🖥️ ARM Technical Outlook – Descending Trendline Pressure
Ticker: ARM (Arm Holdings)
Timeframe: 30-minute candles
🔍 Current Setup
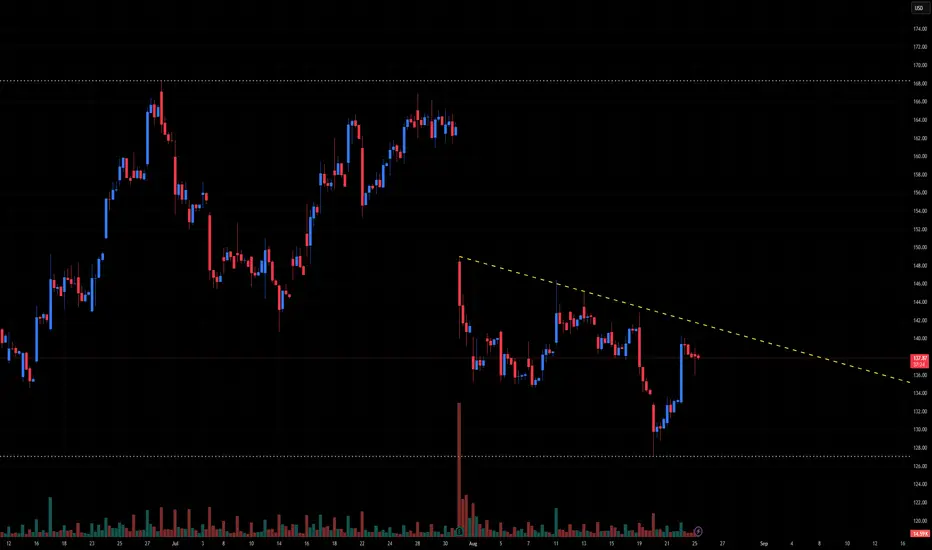
ARM is trading under a descending trendline that has capped rallies since late July. After a sharp drop from ~168, price has been consolidating between 128–144, with sellers consistently stepping in at lower highs.
Descending resistance: ~142 (falling trendline).
Support zone: ~128 (recent base).
Current price: ~138, caught in the middle of the range.
This structure signals ongoing downtrend pressure unless buyers can break above the descending resistance.
📊 Breakout Levels
🚀 Upside (Bullish Scenario)
Trigger: Break and close above 142 (descending trendline).
Intermediate Targets:
148–150 → First supply zone.
158–160 → Major resistance cluster.
Measured Move Target: ~168 (full reversal back to July breakdown).
🔻 Downside (Bearish Scenario)
Trigger: Rejection at resistance and close below 132, confirmation under 128.
Intermediate Supports:
130–128 → Key base support.
122–120 → Next demand area.
Measured Move Target: ~115 (projected from consolidation range).
📈 Volume Analysis
Volume spiked heavily on the July breakdown, confirming bearish momentum.
Current rallies are happening on lower volume, signaling weak buyer conviction.
A breakout above 142 with volume expansion would be required to shift momentum bullish.
⚖️ Probability Bias
Trend remains bearish under the descending trendline.
Bulls must reclaim 142 to flip momentum.
Otherwise, ARM risks another leg lower toward 128 → 120.
✅ Takeaway
ARM is under heavy trendline resistance and stuck in a range:
Bullish Break > 142: Targets 148 → 160 → 168
Bearish Failure < 132 / 128: Targets 122 → 115
Until a breakout occurs, expect continued sideways-to-down bias within the range.
Ticker: ARM (Arm Holdings)
Timeframe: 30-minute candles
🔍 Current Setup
ARM is trading under a descending trendline that has capped rallies since late July. After a sharp drop from ~168, price has been consolidating between 128–144, with sellers consistently stepping in at lower highs.
Descending resistance: ~142 (falling trendline).
Support zone: ~128 (recent base).
Current price: ~138, caught in the middle of the range.
This structure signals ongoing downtrend pressure unless buyers can break above the descending resistance.
📊 Breakout Levels
🚀 Upside (Bullish Scenario)
Trigger: Break and close above 142 (descending trendline).
Intermediate Targets:
148–150 → First supply zone.
158–160 → Major resistance cluster.
Measured Move Target: ~168 (full reversal back to July breakdown).
🔻 Downside (Bearish Scenario)
Trigger: Rejection at resistance and close below 132, confirmation under 128.
Intermediate Supports:
130–128 → Key base support.
122–120 → Next demand area.
Measured Move Target: ~115 (projected from consolidation range).
📈 Volume Analysis
Volume spiked heavily on the July breakdown, confirming bearish momentum.
Current rallies are happening on lower volume, signaling weak buyer conviction.
A breakout above 142 with volume expansion would be required to shift momentum bullish.
⚖️ Probability Bias
Trend remains bearish under the descending trendline.
Bulls must reclaim 142 to flip momentum.
Otherwise, ARM risks another leg lower toward 128 → 120.
✅ Takeaway
ARM is under heavy trendline resistance and stuck in a range:
Bullish Break > 142: Targets 148 → 160 → 168
Bearish Failure < 132 / 128: Targets 122 → 115
Until a breakout occurs, expect continued sideways-to-down bias within the range.
Pernyataan Penyangkalan
Informasi dan publikasi tidak dimaksudkan untuk menjadi, dan bukan merupakan saran keuangan, investasi, perdagangan, atau rekomendasi lainnya yang diberikan atau didukung oleh TradingView. Baca selengkapnya di Persyaratan Penggunaan.
Pernyataan Penyangkalan
Informasi dan publikasi tidak dimaksudkan untuk menjadi, dan bukan merupakan saran keuangan, investasi, perdagangan, atau rekomendasi lainnya yang diberikan atau didukung oleh TradingView. Baca selengkapnya di Persyaratan Penggunaan.