Apollo Hospital: Structure Analysis & Trade Plan
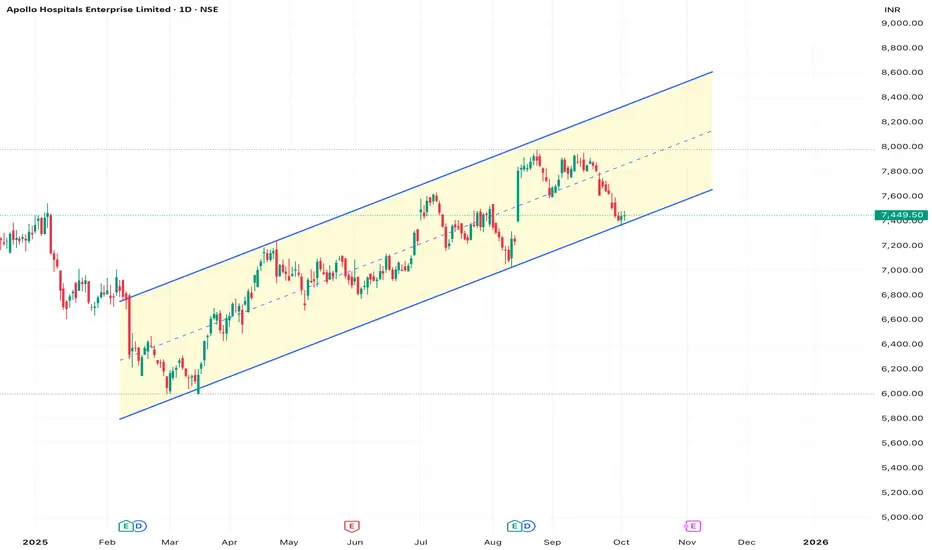
The price is currently sitting at ₹7,449.50, making it a high-interest area from a technical perspective.
Market Structure & Chart Pattern Analysis
Chart Pattern (Classic TA): The price is perfectly tracking the lower boundary (support) of a long-term Upward Channel. This is a classic "Buy the Dip" zone in a well-defined bullish trend structure.
Trend: The macro trend remains Bullish, as defined by the sustained movement within the rising channel since early 2025.
Current Location: The touch of the channel support at ₹7,400 - ₹7,450 offers a low-risk, high-reward entry point for a swing trade.
ICT Concepts for Confirmation
Discount Zone: The price is near the lowest quadrant of the recent price action (relative to the August high), placing it in a Discount Array, making it an opportune area to look for institutional buying.
Liquidity Sweep/Confirmation: The highest probability entry would involve waiting for one of the following on a lower timeframe (e.g., 4H/1H):
A slight break below the channel support (a liquidity grab/sweep of Sell-Side Liquidity - SSL below the recent swing lows) followed by an immediate reversal back into the channel.
A clear formation of a Bullish Order Block (final down candle before the expected strong move up) or an unmitigated Fair Value Gap (FVG) at the channel support line.
Market Structure Shift (MSS): Wait for a short-term MSS on a lower timeframe to confirm the buyers are taking control before entering.
Trade Plan
BUY (Anticipating Channel Bounce)
Entry Zone: ₹7,480 - ₹7,500 (Enter near the channel support, ideally with confirmation)
Stop Loss (SL): Below ₹7,300 (This places the SL clearly outside the channel and below the psychological support, invalidating the bullish channel structure).
Risk: ₹150 - ₹200 per share (The difference between current price/entry and SL).
Target 1 (T1): ₹7,900 - ₹8,000 (Channel Midline & psychological resistance).
Target 2 (T2): ₹8,200 - ₹8,400 (Channel Upper Boundary/Resistance).
Risk/Reward: Favorable (R:R is 1:2 to 1:4 depending on entry and target).
Pernyataan Penyangkalan
Informasi dan publikasi tidak dimaksudkan untuk menjadi, dan bukan merupakan saran keuangan, investasi, perdagangan, atau rekomendasi lainnya yang diberikan atau didukung oleh TradingView. Baca selengkapnya di Persyaratan Penggunaan.
Pernyataan Penyangkalan
Informasi dan publikasi tidak dimaksudkan untuk menjadi, dan bukan merupakan saran keuangan, investasi, perdagangan, atau rekomendasi lainnya yang diberikan atau didukung oleh TradingView. Baca selengkapnya di Persyaratan Penggunaan.