Here’s the analysis of your chart for **Amber Enterprises Ltd (NSE)**:
---
### 📊 **Price Action & Patterns**:
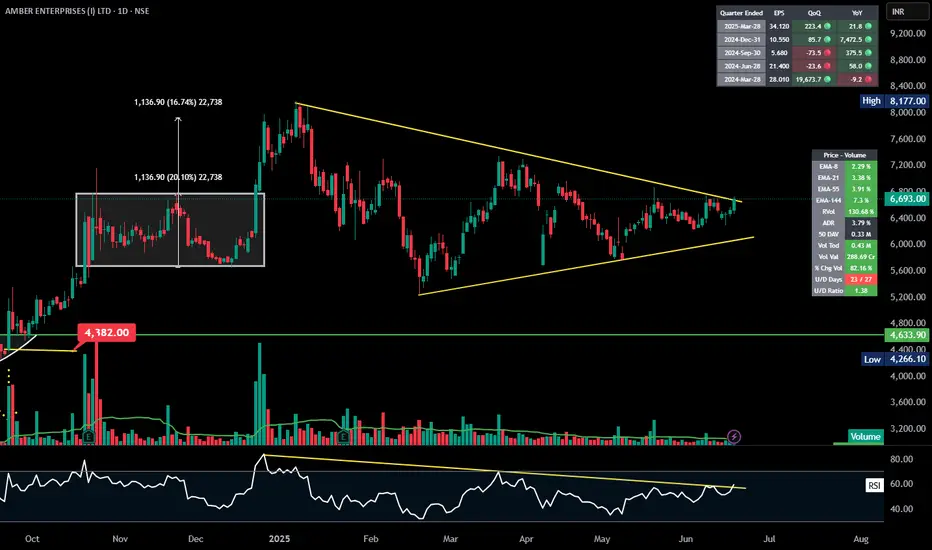
* The stock is forming a **symmetrical triangle** pattern, which is visible by the yellow trendlines.
* Recently, the price has **broken out** above the top trendline around ₹6,693.
* Prior to this triangle, there was a strong upward move — this often increases the probability of an upward continuation.
---
### 📈 **Volume Analysis**:
* Breakout is accompanied by an **increase in volume** (\~0.43M), suggesting strong participation.
* The volume profile also shows that current volume is **higher than average** (50-DMA Vol = 0.33M), reinforcing the breakout strength.
---
### 🔍 **Indicators**:
* **RSI** is breaking above its downward trendline (\~60 level), which indicates a **momentum shift to the upside**.
* Moving averages show short-term EMA (8 & 21) **crossing over** the longer-term averages — supportive of bullish strength.
---
### 🧠 **Key Levels**:
* 📈 **Resistance Breakout** around **₹6,693** — next psychological resistance could be around ₹7,200–7,400.
* 📉 **Support** lies at **₹6,400** (near breakout level) and then ₹6,000.
---
### 🧮 **EPS & Fundamentals**:
* Quarterly EPS (March-2025) at **34.120**, up strongly (223% QoQ, 21.8% YoY), so fundamentals support the move.
---
### ✅ **Summary**:
**Amber Enterprises Ltd** is showing a **technical breakout with strong volume** after consolidating in a symmetrical triangle pattern. Momentum looks positive — a **continuation toward the previous swing high (\~₹7,200)** is possible as long as price stays above ₹6,400.
---
### 📊 **Price Action & Patterns**:
* The stock is forming a **symmetrical triangle** pattern, which is visible by the yellow trendlines.
* Recently, the price has **broken out** above the top trendline around ₹6,693.
* Prior to this triangle, there was a strong upward move — this often increases the probability of an upward continuation.
---
### 📈 **Volume Analysis**:
* Breakout is accompanied by an **increase in volume** (\~0.43M), suggesting strong participation.
* The volume profile also shows that current volume is **higher than average** (50-DMA Vol = 0.33M), reinforcing the breakout strength.
---
### 🔍 **Indicators**:
* **RSI** is breaking above its downward trendline (\~60 level), which indicates a **momentum shift to the upside**.
* Moving averages show short-term EMA (8 & 21) **crossing over** the longer-term averages — supportive of bullish strength.
---
### 🧠 **Key Levels**:
* 📈 **Resistance Breakout** around **₹6,693** — next psychological resistance could be around ₹7,200–7,400.
* 📉 **Support** lies at **₹6,400** (near breakout level) and then ₹6,000.
---
### 🧮 **EPS & Fundamentals**:
* Quarterly EPS (March-2025) at **34.120**, up strongly (223% QoQ, 21.8% YoY), so fundamentals support the move.
---
### ✅ **Summary**:
**Amber Enterprises Ltd** is showing a **technical breakout with strong volume** after consolidating in a symmetrical triangle pattern. Momentum looks positive — a **continuation toward the previous swing high (\~₹7,200)** is possible as long as price stays above ₹6,400.
Pernyataan Penyangkalan
Informasi dan publikasi tidak dimaksudkan untuk menjadi, dan bukan merupakan saran keuangan, investasi, perdagangan, atau rekomendasi lainnya yang diberikan atau didukung oleh TradingView. Baca selengkapnya di Persyaratan Penggunaan.
Pernyataan Penyangkalan
Informasi dan publikasi tidak dimaksudkan untuk menjadi, dan bukan merupakan saran keuangan, investasi, perdagangan, atau rekomendasi lainnya yang diberikan atau didukung oleh TradingView. Baca selengkapnya di Persyaratan Penggunaan.