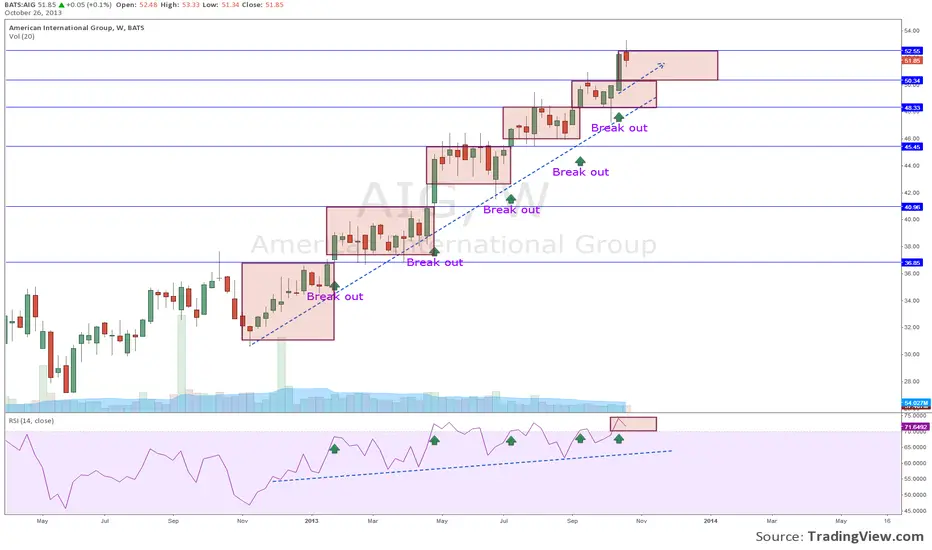
AIG long and strong on the weekly candle.
This is a continuation of a series of previous posted charts .
tradingview.com/v/LCD1fRMj/
tradingview.com/v/KLmqANDH/
tradingview.com/v/kAyKlDdn/
As show here, on weekly chart AIG now broke the resistance at $50.3, into the next zone of consolidation. I expect the RSI to drop a bit (to around 60-70s) before continuing the next leg up. The bullish trend is certainly up and strong.
Disclosure: No position in AIG at the time of analysis
Pernyataan Penyangkalan
Informasi dan publikasi tidak dimaksudkan untuk menjadi, dan bukan merupakan saran keuangan, investasi, perdagangan, atau rekomendasi lainnya yang diberikan atau didukung oleh TradingView. Baca selengkapnya di Persyaratan Penggunaan.
Pernyataan Penyangkalan
Informasi dan publikasi tidak dimaksudkan untuk menjadi, dan bukan merupakan saran keuangan, investasi, perdagangan, atau rekomendasi lainnya yang diberikan atau didukung oleh TradingView. Baca selengkapnya di Persyaratan Penggunaan.