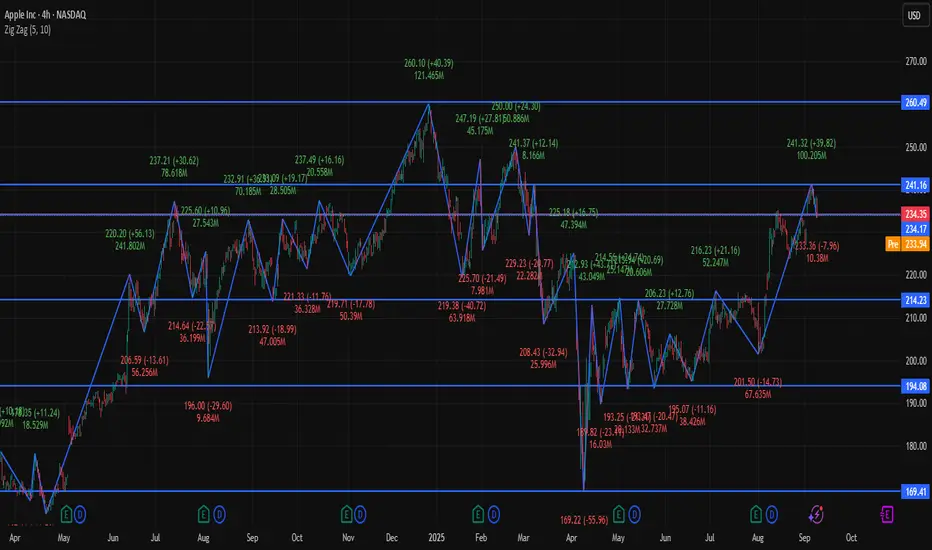
📊 Apple (AAPL) Snapshot
Current Price: ~$234.35
Day Range: $233.01 – $238.66
Open Price: ~$236.73
Market Cap: ~$3.0 Trillion
P/E Ratio: ~30.3
EPS: ~6.59
🔎 Pivot Levels (Daily Basis → useful for 4H)
Pivot Point: ~$234.6
Resistance:
R1: ~$235.9
R2: ~$238.0
R3: ~$239.2
Support:
S1: ~$232.5
S2: ~$231.3
S3: ~$229.1
📉 Technical Indicators (4-Hour Insight)
RSI: ~40 → weak, leaning bearish.
MACD: Negative → bearish momentum.
Moving Averages: Short-term averages show Sell, long-term still supportive (Buy).
📌 4-Hour Frame Outlook
Momentum: Neutral-to-bearish; price is consolidating around the pivot zone ($234–235).
Bullish Scenario: If AAPL breaks above $238, short-term upside could open toward $239+.
Bearish Scenario: If price slips below $232, risk increases for a move toward $230.
✅ Conclusion: On the 4-hour chart, Apple is in a neutral to bearish phase, with weak momentum. Bulls need a breakout above $238 to take control, while bears may dominate if it breaks under $232.
Pernyataan Penyangkalan
The information and publications are not meant to be, and do not constitute, financial, investment, trading, or other types of advice or recommendations supplied or endorsed by TradingView. Read more in the Terms of Use.
Pernyataan Penyangkalan
The information and publications are not meant to be, and do not constitute, financial, investment, trading, or other types of advice or recommendations supplied or endorsed by TradingView. Read more in the Terms of Use.