While the CNBC-driven public keeps buying the stocks because they are "still relatively cheap" the other few percent of those who understand that they are not are looking for a good entry in a short position on S&P. While S&P chart seems to be tracing an ending diagonal it still looks very fuzzy and the end of the ascending movement may be hard to spot in real time.
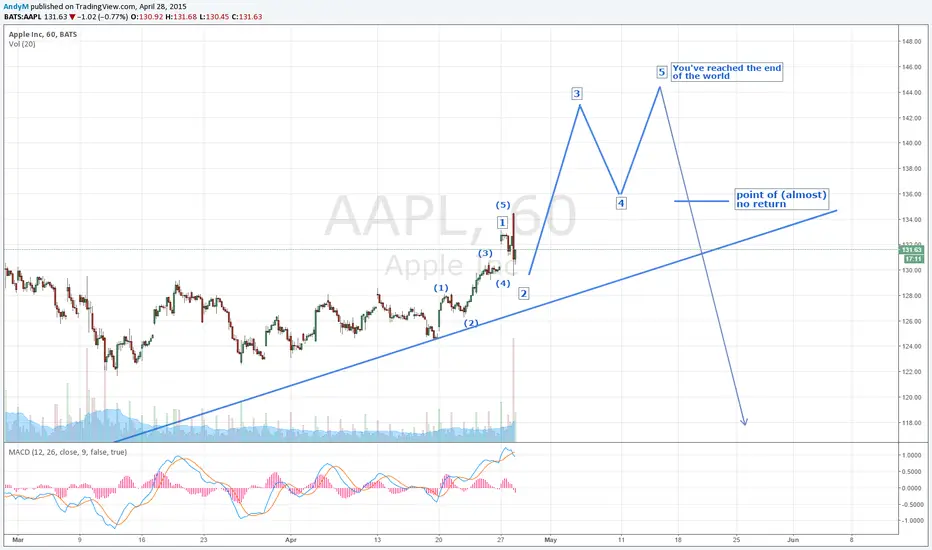
I think an alternative to analyzing the S&P chart would be to look at our flagship and S&P ambassador - AAPL: the last wave 5 of wave 5 is unfolding in front of our eyes. Wave 1 is over, Wave 2 is completing. Wave 3,4,5 are left. Once these are over, S&P is likely done too. I multiplied the duration of wave 1 by three in order to assess the approximate timing of the reversal. We are likely to end at circa 144, on May 14, 5pm GMT. It will be sunny :))
I think an alternative to analyzing the S&P chart would be to look at our flagship and S&P ambassador - AAPL: the last wave 5 of wave 5 is unfolding in front of our eyes. Wave 1 is over, Wave 2 is completing. Wave 3,4,5 are left. Once these are over, S&P is likely done too. I multiplied the duration of wave 1 by three in order to assess the approximate timing of the reversal. We are likely to end at circa 144, on May 14, 5pm GMT. It will be sunny :))
Pernyataan Penyangkalan
Informasi dan publikasi tidak dimaksudkan untuk menjadi, dan bukan merupakan saran keuangan, investasi, perdagangan, atau rekomendasi lainnya yang diberikan atau didukung oleh TradingView. Baca selengkapnya di Persyaratan Penggunaan.
Pernyataan Penyangkalan
Informasi dan publikasi tidak dimaksudkan untuk menjadi, dan bukan merupakan saran keuangan, investasi, perdagangan, atau rekomendasi lainnya yang diberikan atau didukung oleh TradingView. Baca selengkapnya di Persyaratan Penggunaan.