Depth of Market (DOM) [LuxAlgo]The Depth Of Market (DOM) tool allows traders to look under the hood of any market, taking price and volume analysis to the next level. The following features are included: DOM, Time & Sales, Volume Profile, Depth of Market, Imbalances, Buying Pressure, and up to 24 key intraday levels (it really packs a punch).
As a disclaimer, this tool does not use tick data, it is a DOM reconstruction from the provided real-time time series data (price and volume). So the volume you see is from filled orders only, this tool does not show unfilled limit orders.
Traders can enable or disable any of the features at will to avoid being overwhelmed with too much information and to make the tool perform faster.
The features that have the biggest impact on performance are Historical Data Collection, Key Levels (POC & VWAP), Time & Sales, Profile, and Imbalances. Disable these features to improve the indicator computational performance.
🔶 DOM
This is the simplest form of the tool, a simple DOM or ladder that displays the following columns:
PRICE: Price level
BID: Total number of market sell orders filled or limit buy orders filled.
SELL: Sell market orders
BUY: Buy market orders
ASK: Total number of market buy orders filled or limit sell orders filled.
The DOM only collects historical data from the last 24 hours and real-time data.
Traders can select a reset period for the DOM with two options:
DAILY: Resets at the beginning of each trading day
SESSIONS: Resets twice, as DAILY and 15.5 hours later, to coincide with the start of the RTH session for US tickers.
The DOM has two main modes, it can display price levels as ticks or points. The default is automatic based on the current daily volatility, but traders can manually force one mode or the other if they wish.
For convenience, traders have the option to set the number of lines (price levels), and the size of the text and to display only real-time data.
By default, the top price is set to 0 so that the DOM automatically adjusts the price levels to be displayed, but traders can set the top price manually so that the tool displays only the desired price levels in a fixed manner.
🔹 Volume Profile
As additional features to the basic DOM, traders have access to the volume profile histogram and the total volume per price level.
This helps traders identify at a glance key price areas where volume is accumulating (high volume nodes) or areas where volume is lacking (low volume nodes) - these areas are important to some traders who base their decision-making process on them.
🔹 Imbalances
Other added features are imbalances and buying pressure:
Interlevel Imbalance: volume delta between two different price levels
Intralevel Imbalance: delta between buy and sell volume at the same price level
Buying Pressure Percent: percentage of buy volume compared to total volume
Imbalances can help traders identify areas of interest in the price for possible support or resistance.
🔹 Depth
Depth allows traders to see at a glance how much supply is above the current price level or how much demand is below the current price level.
Above the current price level shows the cumulative ask volume (filled sell limit orders) and below the current price level shows the cumulative bid volume (filled buy limit orders).
🔶 KEY LEVELS
The tool includes up to 24 different key intraday levels of particular relevance:
Previous Week Levels
PWH: Previous week high
PWL: Previous week low
PWM: Previous week middle
PWS: Previous week settlement (close)
Previous Day Levels
PDH: Previous day high
PDL: Previous day low
PDM: Previous day middle
PDS: Previous day settlement (close)
Current Day Levels
OPEN: Open of day (or session)
HOD: High of day (or session)
LOD: Low of day (or session)
MOD: Middle of day (or session)
Opening Range
ORH: Open range high
ORL: Open range low
Initial Balance
IBH: Initial balance high
IBL: Initial balance low
VWAP
+3SD: Volume weighted average price plus 3 standard deviations
+2SD: Volume weighted average price plus 2 standard deviations
+1SD: Volume weighted average price plus 1 standard deviation
VWAP: Volume weighted average price
-1SD: Volume weighted average price minus 1 standard deviation
-2SD: Volume weighted average price minus 2 standard deviations
-3SD: Volume weighted average price minus 3 standard deviations
POC: Point of control
Different traders look at different levels, the key levels shown here are objective and specific areas of interest that traders can act on, providing us with potential areas of support or resistance in the price.
🔶 TIME & SALES
The tool also features a full-time and sales panel with time, price, and size columns, a size filter, and the ability to set the timezone to display time in the trader's local time.
The information shown here is what feeds the DOM and it can be useful in several ways, for example in detecting absorption. If a large number of orders are coming into the market but the price is barely moving, this indicates that there is enough liquidity at these levels to absorb all these orders, so if these orders stop coming into the market, the price may turn around.
🔶 SETTINGS
Period: Select the anchoring period to start data collection, DAILY will anchor at the start of the trading day, and SESSIONS will start as DAILY and 15.5 hours later (RTH for US tickers).
Mode: Select between AUTO and MANUAL modes for displaying TICKS or POINTS, in AUTO mode the tool will automatically select TICKS for tickers with a daily average volatility below 5000 ticks and POINTS for the rest of the tickers.
Rows: Select the number of price levels to display
Text Size: Select the text size
🔹 DOM
DOM: Enable/Disable DOM display
Realtime only: Enable/Disable real-time data only, historical data will be collected if disabled
Top Price: Specify the price to be displayed on the top row, set to 0 to enable dynamic DOM
Max updates: Specify how many times the values on the SELL and BUY columns are accumulated until reset.
Profile/Depth size: Maximum size of the histograms on the PROFILE and DEPTH columns.
Profile: Enable/Disable Profile column. High impact on performance.
Volume: Enable/Disable Volume column. Total volume traded at price level.
Interlevel Imbalance: Enable/Disable Interlevel Imbalance column. Total volume delta between the current price level and the price level above. High impact on performance.
Depth: Enable/Disable Depth, showing the cumulative supply above the current price and the cumulative demand below. Impact on performance.
Intralevel Imbalance: Enable/Disable Intralevel Imbalance column. Delta between total buy volume and total sell volume. High impact on performance.
Buying Pressure Percent: Enable/Disable Buy Percent column. Percentage of total buy volume compared to total volume.
Imbalance Threshold %: Threshold for highlighting imbalances. Set to 90 to highlight the top 10% of interlevel imbalances and the top and bottom 10% of intra-level imbalances.
Crypto volume precision: Specify the number of decimals to display on the volume of crypto assets
🔹 Key Levels
Key Levels: Enable/Disable KEY column. Very high performance impact.
Previous Week: Enable/Disable High, Low, Middle, and Close of the previous trading week.
Previous Day: Enable/Disable High, Low, Middle, and Settlement of the previous trading day.
Current Day/Session: Enable/Disable Open, High, Low and Middle of the current period.
Open Range: Enable/Disable High and Low of the first candle of the period.
Initial Balance: Enable/Disable High and Low of the first hour of the period.
VWAP: Enable/Disable Volume-weighted average price of the period with 1, 2, and 3 standard deviations.
POC: Enable/Disable Point of Control (price level with the highest volume traded) of the period.
🔹 Time & Sales
Time & Sales: Enable/Disable time and sales panel.
Timezone offset (hours): Enter your time zone\'s offset (+ or −), including a decimal fraction if needed.
Order Size: Set order size filter. Orders smaller than the value are not displayed.
🔶 THANKS
Hi, I'm makit0 coder of this tool and proud member of the LuxAlgo Opensource team, it's an honor to be part of the LuxAlgo family doing something I love as it's writing opensource code and sharing it with the world. I'd like to thank all of you who use, comment on, and vote for all of our open-source tools, and all of you who give us your support.
And of course thanks to the PineCoders family for all the work in front of and behind the scenes that makes the PineScript community what it is, simply the best.
Peace, Love & PineScript!
Cari skrip untuk "VOLUME DELTA"

Volume / Open Interest "Footprint" - By LeviathanThis script generates a footprint-style bar (profile) based on the aggregated volume or open interest data within your chart's visible range. You can choose from three different heatmap visualizations: Volume Delta/OI Delta, Total Volume/Total OI, and Buy vs. Sell Volume/OI Increase vs. Decrease.
How to use the indicator:
1. Add it to your chart.
2. The script will use your chart's visible range and generate a footprint bar on the right side of the screen. You can move left/right, zoom in/zoom out, and the bar's data will be updated automatically.
Settings:
- Source: This input lets you choose the data that will be displayed in the footprint bar.
- Resolution: Resolution is the number of rows displayed in a bar. Increasing it will provide more granular data, and vice versa. You might need to decrease the resolution when viewing larger ranges.
- Type: Choose between 3 types of visualization: Total (Total Volume or Total Open Interest increase), UP/DOWN (Buy Volume vs Sell Volume or OI Increase vs OI Decrease), and Delta (Buy Volume - Sell Volume or OI Increase - OI Decrease).
- Positive Delta Levels: This function will draw boxes (levels) where Delta is positive. These levels can serve as significant points of interest, S/R, targets, etc., because they mark the zones where there was an increase in buy pressure/position opening.
- Volume Aggregation: You can aggregate volume data from 8 different sources. Make sure to check if volume data is reported in base or quote currency and turn on the RQC (Reported in Quote Currency) function accordingly.
- Other settings mostly include appearance inputs. Read the tooltips for more info.

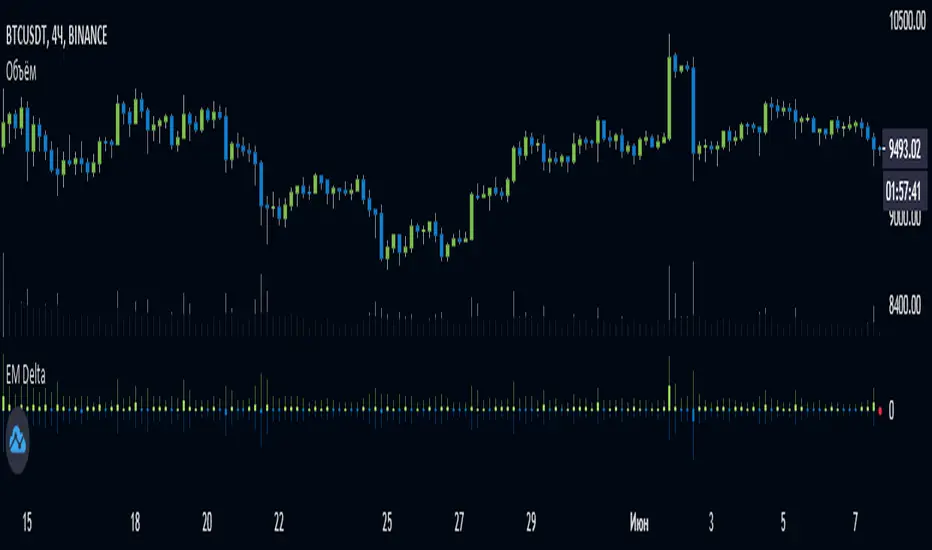
EulerMethod: DeltaEN
Shows the Integral Volume Delta (IVD)
It is a detailed OBV. Each bar sums up the volume for bars of a shorter timeframe.
For example, inside a 1M bar, every 12h bar is added up, and inside a 1h bar, every 1min bar is added. Thus, a conditional volume delta inside the bar is obtained.
The indicator for each bar shows the volume of purchases (positive), sales (negative) and the difference — IVD
The delta histogram is thicker than the volume histograms
Settings detalisation
M — 6 hours, 12 hours and 1 day for the M timeframe (720 by default)
W — 4 hours, 6 hours and 12 hours for the W timeframe (240 by default)
D — 30 minutes, 1 hour and 2 hours for the D timeframe (60 by default)
H — 1 minute, 5 minutes and 15 minutes for timeframes [1h, D) (default is 1)
For timeframes of 15m and less, the calculation is carried out by minute bars
VSA mode
The classic OBV adds volume to the cumulative sum under the condition Сlose (n) > Close (n-1) and subtracts it under the condition Close (n) < Close (n-1)
When VSA mode is disabled, all volumes are summed up under these conditions.
When the VSA approximation is turned on, the volume per bar of detail is divided by the factor (Close - Low) / (High - Low)
That is, it takes into account the spread per bar and closing relative to the spread. VSA is enabled by default
A/D mode
Shows the cumulative Accumulation / Distribution Index
The delta of the detail bar is multiplied by (High + Low + Close) / 3 bars, the result is added to the cumulative sum
No additional price conversions required due to integral summation
Index line view is customizable
EM Delta does not receive intermediate values in real time.
To see the result, wait until the bar closes or switch to a smaller timeframe
RU
Показывает Интегральную Дельту Объёма (ИДО)
Представляет собой детализированный OBV. В каждом баре суммируется объём за бары меньшего таймфрейма.
Например, внутри 1М-бара суммируется каждый 12h-бар, а внутри 1h — каждый 1m-бар. Таким образом получается условная дельта объёма внутри бара
Индикатор на каждый бар показывает объём покупок (положительный), объём продаж (отрицательный) и разницу — ИДО
Гистограмма дельты толще гистограмм объёмов
Настройки детализации внутри бара
M — 6 часов, 12 часов и 1 день для таймфрейма M (по-умолчанию 720)
W — 4 часа, 6 часов и 12 часов для таймфрейма W (по-умолчанию 240)
D — 30 минут, 1 час и 2 часа для таймфрейма D (по-умолчанию 60)
H — 1 минута, 5 минут и 15 минут для таймфреймов [1h, D) (по-умолчанию 1)
Для таймфреймов 15m и меньше расчёт ведётся по минутным барам
Режим VSA
Классический OBV прибавляет объём к кумулятивной сумме при условии Сlose(n) > Close(n-1) и отнимает при условии Close(n) < Close(n-1)
При отключении режима VSA все объёмы суммируются по этим условиям
При включённой VSA-аппроксимации объём за бар детализации делится по фактору (Close - Low) / (High - Low)
То есть учитывает спред за бар и закрытие относительно спреда. По-умолчанию режим VSA включен
Режим A/D
Показывает кумулятивный индекс Накопления/Распределения
Дельта бара детализации умножается на (High + Low + Close) / 3 бара, результат прибавляется к кумулятивной сумме
Дополнительные преобразования цены не требуются ввиду интегрального суммирования
Вид линии индекса настраивается
EM Delta не получает промежуточные значения в реальном времени.
Чтобы увидеть результат, дождитесь закрытия бара или перейдите на меньший таймфрейм
Info Panel (RSI, ADX, Volume,EMA, Delta)📊 Info Panel PRO — All-in-One Trader Dashboard
Simplify market analysis at a glance.
This powerful indicator displays key market metrics in a compact, customizable table directly overlaid on your chart — ideal for day trading, scalping, and swing trading strategies.
🔍 What’s Included:
✅ RSI (Relative Strength Index) — Measures overbought/oversold conditions.
✅ ADX (Average Directional Index) — Gauges trend strength (>25 = strong trend).
✅ Price vs 200 EMA on 4H timeframe — Strategic support/resistance level for multi-timeframe context.
✅ Current Bar Volume — Color-coded to reflect bullish/bearish sentiment.
✅ Volume Delta — Net buying/selling pressure on your chosen timeframe (default: 1 minute).
✅ CVD (Cumulative Volume Delta) — Daily running total of delta, resets each new trading day.
⚙️ Fully Customizable Settings:
Adjustable lengths for RSI, ADX, and EMA.
Select delta calculation timeframe — lower = more granular (e.g., “1” for 1-minute precision).
Table position: top/bottom left/right corners.
Color themes: Customize bullish, bearish, and neutral colors to match your style.
💡 Who Is This For?
Scalpers & Day Traders needing real-time market context without clutter.
Swing & Position Traders monitoring higher-timeframe structure and momentum.
Order Flow & Volume Analysts tracking buyer/seller imbalance via delta and CVD.
Beginners learning to read markets through consolidated, intuitive indicators.
🎯 Key Benefits:
✅ Clean, minimalist UI — stays out of your way while delivering critical data.
✅ Auto-formatting for large numbers (K, M, B) — easy readability.
✅ Visual cues (arrows, color coding) for instant decision-making.
✅ Works across all markets: Forex, Stocks, Crypto, Futures.
📌 How to Use:
Add the indicator to your chart.
Tweak settings to fit your trading style.
Monitor real-time updates — all essential metrics visible in one place.
Combine with other strategies (price action, S/R, VWAP) for signal confirmation.
📌 Pro Tip: For maximum edge, pair Info Panel PRO with liquidity zones, VWAP, or Market Profile tools.
📈 Trade smarter — let the market speak to you in clear, actionable terms.
Author:
Version: 1.0
Language: Pine Script v5
Overlay: Yes (draws directly on price chart)
😄
“If this indicator were a person, they’d be called ‘The One Who Knows Everything… But Never Gives Unsolicited Advice.’
…Unlike your ‘friend’ who yells ‘BUY!’ five minutes before the market crashes.”
“A good trader isn’t the one who predicts the market.
It’s the one who has everything on their chart — coffee optional.
…Want the next indicator? Comment ‘YES’ below — and I’ll build you ‘Smart Alert PRO’ or ‘Volume Sniper’ next.”
P.S. If this script saves even ONE trade — hit 👍.
If it saves TWO — comment “THANK YOU” 🙏
If it saves THREE — expect “Volume Heatmap PRO” next week 😉🔥

AI's Opinion Trading System V21. Complete Summary of the Indicator Script
AI’s Opinion Trading System V2 is an advanced, multi-factor trading tool designed for the TradingView platform. It combines several technical indicators (moving averages, RSI, MACD, ADX, ATR, and volume analysis) to generate buy, sell, and hold signals. The script features a customizable AI “consensus” engine that weighs multiple indicator signals, applies user-defined filters, and outputs actionable trade instructions with clear stop loss and take profit levels. The indicator also tracks sentiment, volume delta, and allows for advanced features like pyramiding (adding to positions), custom stop loss/take profit prices, and flexible signal confirmation logic. All key data and signals are displayed in a dynamic, color-coded table on the chart for easy review.
2. Full Explanation of the Table
The table is a real-time dashboard summarizing the indicator’s logic and recommendations for the most recent bars. It is color-coded for clarity and designed to help traders quickly understand market conditions and AI-driven trade signals.
Columns (from left to right):
Column Name What it Shows
Bar The time context: “Now” for the current bar, then “Bar -1”, “Bar -2”, etc. for previous bars.
Raw Consensus The raw AI consensus for each bar: “Buy”, “Sell”, or “-” (neutral).
Up Vol The amount of volume on up (rising) bars.
Down Vol The amount of volume on down (falling) bars.
Delta The difference between up and down volume. Green if positive, red if negative, gray if neutral.
Close The closing price for each bar, color-coded by price change.
Sentiment Diff The difference between the close and average sentiment price (a custom sentiment calculation).
Lookback The number of bars used for sentiment calculation (if enabled).
ADX The ADX value (trend strength).
ATR The ATR value (volatility measure).
Vol>Avg “Yes” (green) if volume is above average, “No” (red) otherwise.
Confirm Whether the AI signal is confirmed over the required bars.
Logic Output The AI’s interpreted signal after applying user-selected logic: “Buy”, “Sell”, or “-”.
Final Action The final signal after all filters: “Buy”, “Sell”, or “-”.
Trade Instruction A plain-English instruction: Buy/Sell/Add/Hold/No Action, with price, stop loss, and take profit.
Color Coding:
Green: Positive/bullish values or signals
Red: Negative/bearish values or signals
Gray: Neutral or inactive
Blue background: For all table cells, for visual clarity
White text: Default, except for color-coded cells
3. Full User Instructions for Every Input/Style Option
Below are plain-language instructions for every user-adjustable option in the indicator’s input and style pages:
Inputs
Table Location
What it does: Sets where the summary table appears on your chart.
How to use: Choose from 9 positions (Top Left, Top Center, Top Right, etc.) to avoid overlapping with other chart elements.
Decimal Places
What it does: Controls how many decimal places prices and values are displayed with.
How to use: Increase for assets with very small prices (e.g., SHIB), decrease for stocks or forex.
Show Sentiment Lookback?
What it does: Shows or hides the “Lookback” column in the table, which displays how many bars are used in the sentiment calculation.
How to use: Turn off if you want a simpler table.
AI View Mode
What it does: Selects the logic for how the AI combines signals from different indicators.
Majority: Follows the most common signal among all indicators.
Weighted: Uses custom weights for each type of signal.
Custom: Lets you define your own logic (see below).
How to use: Pick the logic style that matches your trading philosophy.
AI Consensus Weight / Vol Delta Weight / Sentiment Weight
What they do: When using “Weighted” AI View Mode, these let you set how much influence each factor (indicator consensus, volume delta, sentiment) has on the final signal.
How to use: Increase a weight to make that factor more important in the AI’s decision.
Custom AI View Logic
What it does: Lets advanced users write their own logic for when the AI should signal a trade (e.g., “ai==1 and delta>0 and sentiment>0”).
How to use: Only use if you understand basic boolean logic.
Use Custom Stop Loss/Take Profit Prices?
What it does: If enabled, you can enter your own fixed stop loss and take profit prices for buys and sells.
How to use: Turn on to override the auto-calculated SL/TP and enter your desired prices below.
Custom Buy/Sell Stop Loss/Take Profit Price
What they do: If custom SL/TP is enabled, these fields let you set exact prices for stop loss and take profit on both buy and sell trades.
How to use: Enter your preferred price, or leave at 0 for auto-calculation.
Sentiment Lookback
What it does: Sets how many bars the sentiment calculation should look back.
How to use: Increase to smooth out sentiment, decrease for faster reaction.
Max Pyramid Adds
What it does: Limits how many times you can add to an existing position (pyramiding).
How to use: Set to 1 for no adds, higher for more aggressive scaling in trends.
Signal Preset
What it does: Quick-sets a group of signal parameters (see below) for “Robust”, “Standard”, “Freedom”, or “Custom”.
How to use: Pick a preset, or select “Custom” to adjust everything manually.
Min Bars for Signal Confirmation
What it does: Sets how many bars a signal must persist before it’s considered valid.
How to use: Increase for more robust, less frequent signals; decrease for faster, but possibly less reliable, signals.
ADX Length
What it does: Sets the period for the ADX (trend strength) calculation.
How to use: Longer = smoother, shorter = more sensitive.
ADX Trend Threshold
What it does: Sets the minimum ADX value to consider a trend “strong.”
How to use: Raise for stricter trend confirmation, lower for more trades.
ATR Length
What it does: Sets the period for the ATR (volatility) calculation.
How to use: Longer = smoother volatility, shorter = more reactive.
Volume Confirmation Lookback
What it does: Sets how many bars are used to calculate the average volume.
How to use: Longer = more stable volume baseline, shorter = more sensitive.
Volume Confirmation Multiplier
What it does: Sets how much current volume must exceed average volume to be considered “high.”
How to use: Increase for stricter volume filter.
RSI Flat Min / RSI Flat Max
What they do: Define the RSI range considered “flat” (i.e., not trending).
How to use: Widen to be stricter about requiring a trend, narrow for more trades.
Style Page
Most style settings (such as plot colors, label sizes, and shapes) are preset in the script for visual clarity.
You can adjust plot visibility and colors (for signals, stop loss, take profit) in the TradingView “Style” tab as with any indicator.
Buy Signal: Shows as a green triangle below the bar when a buy is triggered.
Sell Signal: Shows as a red triangle above the bar when a sell is triggered.
Stop Loss/Take Profit Lines: Red and green lines for SL/TP, visible when a trade is active.
SL/TP Labels: Small colored markers at the SL/TP levels for each trade.
How to use:
Toggle visibility or change colors in the Style tab if you wish to match your chart theme or preferences.
In Summary
This indicator is highly customizable—you can tune every aspect of the AI logic, risk management, signal filtering, and table display to suit your trading style.
The table gives you a real-time, comprehensive view of all relevant signals, filters, and trade instructions.
All inputs are designed to be intuitive—hover over them in TradingView for tooltips, or refer to the explanations above for details.

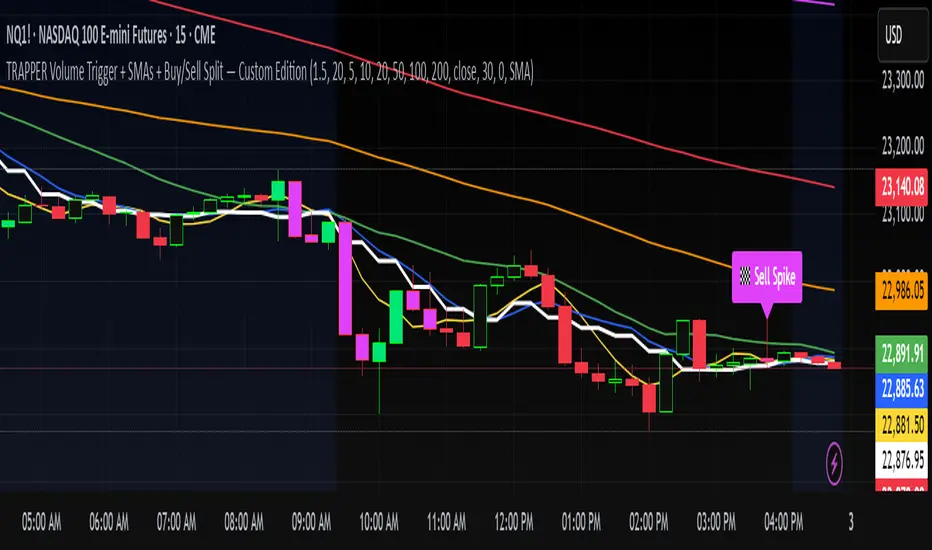
TRAPPER Volume Trigger + SMAs + Buy/Sell SplitThe TRAPPER TRIGGER is a precision-based volume spike indicator designed for intraday traders, scalpers, and swing traders who rely on key volume activity to anticipate sharp market movements. It operates on volume delta logic, detecting disproportionate buying or selling activity that signifies potential market reversals or breakouts.
How It Works:
Volume Spike Logic (Delta-Based)
The script calculates a dynamic volume threshold using a moving average of historical volume data.
It identifies a delta spike by comparing current volume against this threshold—when volume exceeds it significantly, it suggests abnormal activity.
If the candle closes higher than it opens (bullish), the script registers it as a Buy Spike ⚖️.
If the candle closes lower than it opens (bearish), it marks a Sell Spike 🏁.
These are not based on the candle’s body size but the volume differential (delta) between buy/sell pressure inferred from candle direction.
Trigger Labels
Only the most recent buy/sell spike is labeled for clarity, avoiding clutter.
Labels are color-coded to match the candle body (e.g., bright green for bullish, magenta for bearish).
Label style: ⚖️ for Buy Spikes, 🏁 for Sell Spikes.
SMA Suite (Fully Customizable):
Six SMAs: 5 (yellow), 10 (blue), 20 (green), 50 (orange), 100 (red), 200 (white).
Each can be toggled and customized in the script settings for visibility and styling.
Key Benefits
Clean, minimalistic charting — focuses only on high-probability events.
Provides delta-driven insights without requiring access to full L2 order book data.
Works across any timeframe — logic recalculates and resets zones per timeframe switch.
Designed for sniper-style entries—ideal for traders who prefer minimal noise and maximum signal clarity.
Easily extendable with SR zones, AVWAP, liquidity levels, or alerts if desired in future updates.
Who It’s For
Scalpers and intraday traders looking for clean triggers.
Swing traders wanting confirmation of institutional moves.
Volume profile enthusiasts who need a trigger alert system.
Developers who want a base volume framework to build more advanced tools on.
Disclaimer
This script is provided as-is and is intended for educational and informational purposes only. It does not constitute financial advice, investment recommendations, or a solicitation to buy or sell any security or asset.
All trading involves risk. Users should perform their own due diligence and consult with a qualified financial advisor before making any trading decisions. The author of this script assumes no liability for any losses or damages arising from the use or reliance on this tool.
By using this script, you acknowledge and agree that you are solely responsible for your own trading decisions and outcomes.
MultiTFlevels with Volume Display1. Overview
This indicator is intended for use on trading platforms like TradingView and provides the following features:
Volume Profile Analysis:
Shows cumulative volume delta (CVD) and displays buying and selling volumes.
Historical OHLC Levels:
Plots historical open, high, low, and close levels for various timeframes (e.g., daily, weekly, monthly).
Customizable Settings:
Allows users to toggle different elements and customize display options.
2. Inputs
Timeframe Display Toggles:
Users can choose to display OHLC levels from different timeframes such as previous month, week, day, 4H, 1H, 30M, 15M, and 5M.
CVD Display Toggle: Option to show or hide the Cumulative Volume Delta (CVD).
Line and Label Customization:
leftOffset and rightOffset: Define how far lines are extended left and right from the current bar.
colorMonth, colorWeek, etc.: Customize colors for different timeframe OHLC levels.
labelOffset and rightOffset: Control the positioning of volume labels.
3. Key Features
Cumulative Volume Delta (CVD)
Calculation:
Computes the cumulative volume delta by adding or subtracting the volume based on whether the close price is higher or lower than the open price.
Display:
Shows a label on the chart indicating the current CVD value and whether the market is leaning towards buying or selling.
Historical OHLC Levels
Data Retrieval:
Uses the request.security function to fetch OHLC data from different timeframes (e.g., monthly, weekly, daily).
Plotting:
Draws lines and labels on the chart to represent open, high, low, and close levels for each selected timeframe.
Buying and Selling Volumes
Calculation:
Calculates buying and selling volumes based on whether the close price is higher or lower than the open price.
Display:
Shows labels on the chart for buying and selling volumes.
4. Functions
getOHLC(timeframe)
Retrieves open, high, low, and close values from the specified timeframe.
plotOHLC(show, open, high, low, close, col, prefix)
Draws OHLC lines and labels on the chart for the given timeframe and color.
5. Usage
Chart Overlay: The indicator is overlaid on the main chart (i.e., it appears directly on the price chart).
Historical Analysis:
Useful for analyzing historical price levels and volume dynamics across different timeframes.
Volume Insights:
Helps traders understand the cumulative volume behavior and market sentiment through the CVD and volume labels.
In essence, this indicator provides a comprehensive view of historical price levels across multiple timeframes and the dynamics of market volume through CVD and volume labels. It can be particularly useful for traders looking to combine price action with volume analysis for a more in-depth market assessment.
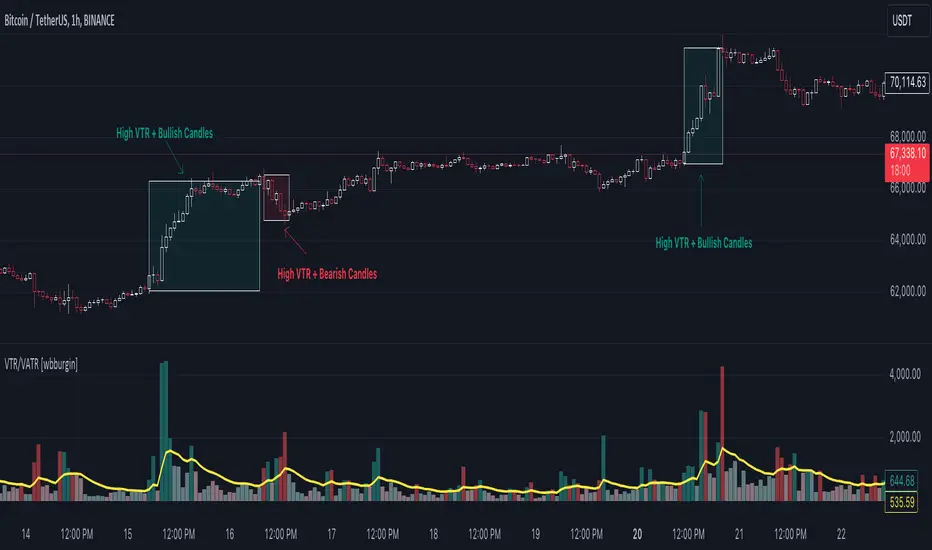
Volume True Range (VTR) and Volume Average True Range (VATR)This indicator uses lower-timeframe cumulative volume delta (CVD) candles to calculate the Volume True Range (VTR) of your instrument. The VTR is calculated similarly to the traditional true range, but uses volume instead (no price is involved in the calculation other than in the lower timeframe bar delta assignments). I haven't seen this concept developed before on TradingView or frankly the Internet, but I thought it seemed fairly intuitive; we can calculate the lower timeframe volume delta candles, so it makes sense to calculate a volume true range, which could show divergences in volume and price.
The VTR is calculated by the following code which uses the lower-timeframe CVD candles:
volumeTR = math.max(cvd_high - cvd_low, math.abs(cvd_high - nz(cvd_close )), math.abs(cvd_low - nz(cvd_close )))
The Volume Average True Range (VATR) is calculated by taking the RMA of the VTR, similarly to the ATR.
I would like to thank TradingView for the calculation of up/down intrabar volumes, which I referenced from their 'CVD - Cumulative Volume Delta Candles' indicator.
How to Use
The VTR and VATR can be used to identify price-volume trends and volatility divergences. A strong VTR (above the VATR of your specified length) can indicate the start or continuation of a trend, which you can identify via the VTR color (determined via price candle colors). Similarly, a rising VATR with most VTR bars of a specific color (green or red) will show that volume is moving in a specific price direction.
Additionally, the VATR plotted next to the ATR of the same length will show you volume volatility divergences. A strong VATR next to a muted/flat ATR indicates strong volume movement, which price might follow in the upcoming bars. Or, for trend reversals, a decreasing ATR after a strong trend combined with a rising VATR of the opposite trend may show a possible reversal.
Hope you all enjoy this.
-wbburgin
* Quick note: lower timeframe analysis returns only so much data. If you are on a high timeframe and the indicator is showing only a limited amount of bars, raise the lower timeframe (but still keep it below your current timeframe) so that the arrays can return more bars for you.
Osmosis [ChartPrime]Osmosis is a multi indicator, multi period heatmap. Lookback periods can be mysterious as it can tend to seem very arbitrary. This tool allows users to see how price/volume reacts to short to long periods by visualizing all of the periods at the same time. This is useful because small periods are only good for short term movements while long periods are useful for long term movements. This more detailed view of market trends is analogues of multi time frame analysis. The lookback periods are arranged from bottom up, where the bottom of the indicator is the shortest period while the top is the longest period.
One major feature of this indicator is its ability to signal potential trend reversals. For example, a shift in the direction at the lower end of the heatmap can indicate a weakening of the current trend, suggesting a possible reversal. On the other hand, when the heatmap is fully saturated at all levels, it may indicate a strong trend that could be nearing a reversal point.
Another important and unique aspect of the Osmosis indicator is its automatic highlighting feature. This feature emphasizes regions within the heatmap that score exceptionally high or low, drawing attention to significant market movements or potential anomalies.
All of the indicators are normalized using min/max scaling driven by the highest highs and lows. The period of this scaling is adjustable by changing the "Lookback" parameter under settings. Delta length changes the lookback for "MA Delta" and "Volume Delta". A longer period corresponds to a smoother output. Fast Mode scales back the range of the indicator, literally halving the increment.
Here is a short description of what each input does:
Alternate Source: A choice to use a different data source for the indicator.
Source: An option to turn on or off the alternate data source.
Style: A selection menu to choose the visual style of the indicator.
Lookback: Adjusts how far back in time the indicator looks for its calculations.
Delta Length: Changes the length of time over which changes are measured.
Fast Mode: A setting that adjusts the range of the indicator for quicker analysis.
Enable Smoothing: A choice to smooth out the data for a cleaner look.
Smooth: Activates the smoothing feature.
Max Region: Highlights the highest value regions in the heatmap.
Max Threshold: Sets the threshold for what counts as a 'max' region.
Minimum Max Width: Determines the smallest size for a 'max' region to be highlighted.
Max Region Color: Chooses the color for the maximum value regions.
Max Top Line Alpha: Adjusts the transparency of the top line in max regions.
Max Bottom Line Alpha: Adjusts the transparency of the bottom line in max regions.
Line Width: Sets the thickness of the lines in the max regions.
Region Start Indication: Specifies where the max region starts.
Fill Max: Decides if the max regions should be filled with color and sets the transparency level for the color fill in max regions.
Minimum Region: Highlights the lowest value regions in the heatmap.
Minimum Threshold: Sets the threshold for what counts as a 'min' region.
Minimum Minimum Width: Determines the smallest size for a 'min' region to be highlighted.
Minimum Region Color: Chooses the color for the minimum value regions.
Minimum Top Line Alpha: Adjusts the transparency of the top line in min regions.
Minimum Bottom Line Alpha: Adjusts the transparency of the bottom line in min regions.
Minimum Line Width: Sets the thickness of the lines in the min regions.
Minimum Region Start Indication: Specifies where the min region starts.
Fill Minimum: Decides if the min regions should be filled with color and sets the transparency level for the color fill in min regions.
Color Presets: Provides pre-set color schemes.
Invert Color Scale: Flips the color scale.
Gradient Colors: Customizes individual colors for the gradient scale.
Available styles include:
'MACD Histogram'
'Normalized MACD'
'Slow MACD'
'MACD Percent Rank'
'MA Delta' (Delta Length set to 2)
'BB Width'
'BB Width Percentile'
'Stochastic'
'RSI'
'True Range OSC'
'Normalized Volume'
'Volume Delta'
'True Range'
'Rate of Change' (Smoothing set to 1)
'OBV' (Smoothing set to 1)
'MFI' (Smoothing set to 1)
'Trend Angle' (Smoothing set to 2 and fast mode off)

Supply Demand Profiles [LuxAlgo]The Supply Demand Profiles is a charting tool that measures the traded volume at all price levels on the market over a specified time period and highlights the relationship between the price of a given asset and the willingness of traders to either buy or sell it, in other words, highlights key concepts as significant supply & demand zones, the distribution of the traded volume, and market sentiment at specific price levels within a specified time period, allowing traders to reveal dominant and/or significant price levels and to analyze the trading activity of a particular user-selected range.
In other words, this tool highlights key concepts as significant supply & demand zones, the distribution of the traded volume, and market sentiment at specific price levels within a specified time period, allowing traders to reveal dominant and/or significant price levels and to analyze the trading activity of a particular user-selected range.
Besides having the tool as a combo tool, the uniqueness of this version of the tool compared to its early versions is its ability to benefit from different volume data sources and its ability to use a variety of different polarity methods, where polarity is a measure used to divide the total volume into either up volume (trades that moved the price up) or down volume (trades that moved the price down).
🔶 USAGE
Supply & demand zones are presented as horizontal zones across the selected range, hence adding the ability to visualize the price interaction with them
By default, the right side of the profile is the volume profile which highlights the distribution of the traded activity at different price levels, emphasizing the value area, the range of price levels in which the specified percentage of all volume was traded during the time period, and levels of significance, such as developing point of control line, value area high/low lines, and profile high/low labels
The left side of the profile is the sentiment profile which highlights the market sentiment at specific price levels
🔶 DETAILS
🔹 Volume data sources
The users have the option to select volume data sources as either 'volume' (regular volume) or 'volume delta', where volume represents all the recorded trades that occur at a given bar and volume delta is the difference between the buying and the selling volume, that is, the net demand at a given bar
🔹 Polarity methods
The users are able to choose the methods of how the tool to take into consideration the polarity of the bar (the direction of a bar, green (bullish) or red (bearish) bar) among a variety of different options, such as 'bar polarity', 'bar buying/selling pressure', 'intrabar (chart bars at a lower timeframe than the chart's) polarity', 'intrabar buying/selling pressure', and 'heikin ashi bar polarity'.
Finally, the interactive mode of the tool is activated, as such users can easily modify the intervals of their interest just by selecting the indicator and moving the points on the chart
🔶 SETTINGS
The script takes into account user-defined parameters and plots the profiles and zones
🔹 Calculation Settings
Volume Data Source and Polarity: This option is to set the desired volume data source and polarity method
Lower Timeframe Precision: This option is applicable in case any of the 'Intrabar (LTF)' options are selected, please check the tooltip for further details
Value Area Volume %: Specifies the percentage for the value area calculation
🔹 Presentation Settings
Supply & Demand Zones: Toggles the visibility of the supply & demand zones
Volume Profile: Toggles the visibility of the volume profile
Sentiment Profile: Toggles the visibility of the sentiment profile
🔹 Presentation, Others
Value Area High (VAH): Toggles the visibility of the VAH line and color customization option
Point of Control (POC): Toggles the visibility of the developing POC line and color customization option
Value Area Low (VAL): Toggles the visibility of the VAL line and color customization option
🔹 Supply & Demand, Others
Supply & Demand Threshold %: This option is used to set the threshold value to determine supply & demand zones
Supply/Demand Zones: Color customization option
🔹 Volume Profile, Others
Profile, Up/Down Volume: Color customization option
Value Area, Up/Down Volume: Color customization option
🔹 Sentiment Profile, Others
Sentiment, Bullish/Bearish: Color customization option
Value Area, Bullish/Bearish: Color customization option
🔹 Others
Number of Rows: Specify how many rows the profile will have
Placment: Specify where to display the profile
Profile Width %: Alters the width of the rows in the profile, relative to the profile range
Profile Price Levels: Toggles the visibility of the profile price levels
Profile Background, Color: Fills the background of the profile range
Value Area Background, Color: Fills the background of the value area range
Start Calculation/End Calculation: The tool is interactive, where the user may modify the range by selecting the indicator and moving the points on the chart or can set the start/end time using these options
🔶 RELATED SCRIPTS
Volume-Profile
Volume-Profile-Maps
Volume-Delta

Strategy Myth-Busting #11 - TrendMagic+SqzMom+CDV - [MYN]This is part of a new series we are calling "Strategy Myth-Busting" where we take open public manual trading strategies and automate them. The goal is to not only validate the authenticity of the claims but to provide an automated version for traders who wish to trade autonomously.
Our 11th one is an automated version of the "Magic Trading Strategy : Most Profitable Indicator : 1 Minute Scalping Strategy Crypto" strategy from "Fx MENTOR US" who doesn't make any official claims but given the indicators he was using, it looked like on the surface that this might actually work. The strategy author uses this on the 1 minute and 3 minute timeframes on mostly FOREX and Heiken Ashi candles but as the title of his strategy indicates is designed for Crypto. So who knows..
To backtest this accurately and get a better picture we resolved the Heiken Ashi bars to standard candlesticks . Even so, I was unable to sustain any consistency in my results on either the 1 or 3 min time frames and both FOREX and Crypto. 10000% Busted.
This strategy uses a combination of 3 open-source public indicators:
Trend Magic by KivancOzbilgic
Squeeze Momentum by LazyBear
Cumulative Delta Volume by LonesomeTheBlue
Trend Magic consists of two main indicators to validate momentum and volatility. It uses an ATR like a trailing Stop to determine the overarching momentum and CCI as a means to validate volatility. Together these are used as the primary indicator in this strategy. When the CCI is above 0 this is confirmation of a volatility event is occurring with affirmation based upon current momentum (ATR).
The CCI volatility indicator gets confirmation by the the Cumulative Delta Volume indicator which calculates the difference between buying and selling pressure. Volume Delta is calculated by taking the difference of the volume that traded at the offer price and the volume that traded at the bid price. The more volume that is traded at the bid price, the more likely there is momentum in the market.
And lastly the Squeeze Momentum indicator which uses a combination of Bollinger Bands, Keltner Channels and Momentum are used to again confirm momentum and volatility. During periods of low volatility, Bollinger bands narrow and trade inside Keltner channels. They can only contract so much before it can’t contain the energy it’s been building. When the Bollinger bands come back out, it explodes higher. When we see the histogram bar exploding into green above 0 that is a clear confirmation of increased momentum and volatile. The opposite (red) below 0 is true when there are low periods. This indicator is used as a means to really determine when there is premium selling plays going on leading to big directional movements again confirming the positive or negative momentum and volatility direction.
If you know of or have a strategy you want to see myth-busted or just have an idea for one, please feel free to message me.
Trading Rules
1 - 3 min candles
FOREX or Crypto
Stop loss at swing high/low | 1.5 risk/ratio
Long Condition
Trend Magic line is Blue ( CCI is above 0) and above the current close on the bar
Squeeze Momentum's histogram bar is green/lime
Cumulative Delta Volume line is green
Short Condition
Trend Magic line is Red ( CCI is below 0) and below the current close on the bar
Squeeze Momentum's histogram bar is red/maroon
Cumulative Delta Volume line is peach

CVD – Visible Range Candles & Line (Cumulative Delta Volume)Disclaimer:
This indicator is provided for informational and educational purposes only. It does not constitute investment advice, trading advice, or a recommendation to buy or sell any financial instrument. The author assumes no liability for any losses, damages, or errors arising from use or misuse of this script. Please test thoroughly and use at your own risk.
________________________________________________________________________________
Purpose
This indicator provides a fast and clear visualization of Cumulative Delta Volume (CVD) for the currently visible chart range in TradingView. It helps traders identify buy/sell volume pressure and market sentiment over any custom timeframe, with full control over reset intervals and chart style.
Key Features
CVD by Visible Bars: Dynamically calculates CVD only for bars currently visible on the chart, so scrolling and zooming always rescale the line and candles to your view.
Style Selection: Choose line or candlestick display. Candles include both standard OHLC and optional Heikin Ashi smoothing.
Automatic Resets: Restart CVD accumulation at the beginning of every day, week, month, or quarter. Choose ‘None’ for ongoing accumulation.
Fully Custom Colors: Line color, candle body, wick, border – all optimized for clarity and customizable via the indicator’s Style tab.
Autoscale Support: Always fits your timeframe. No need to adjust scale manually.
Zero-Level Reference: Includes a horizontal zero line for quick reversal detection.
Input Parameters
Style: "Line" or "Candles" – controls visual type
Heikin Ashi candles: Enable smoothing for candle view
Show Line: Toggle CVD line visibility
Reset CVD: Options: None, Daily, Weekly, Monthly, Quarterly
How To Use
Add the indicator to your TradingView chart.
Select your preferred visual style (Line or Candles).
Choose reset frequency based on your trading timeframe.
Customize colors in the Style tab (line, candle up/down, wick, border).
Scroll or zoom on the chart – the indicator’s range always fits the currently visible bars.
Typical Use Cases
Intraday traders tracking open/close session volume delta
Swing traders identifying quarterly or monthly market accumulations
Visualizing buy/sell pressure divergence at reversal points
Comparing volume sentiment across flexible chart intervals
Formula
Delta calculation: Delta=volume×(sign(close−open))
Accumulation: Resets at user-chosen intervals, CVD plotted for only visible bars
Author
Created by Ronen Cohen

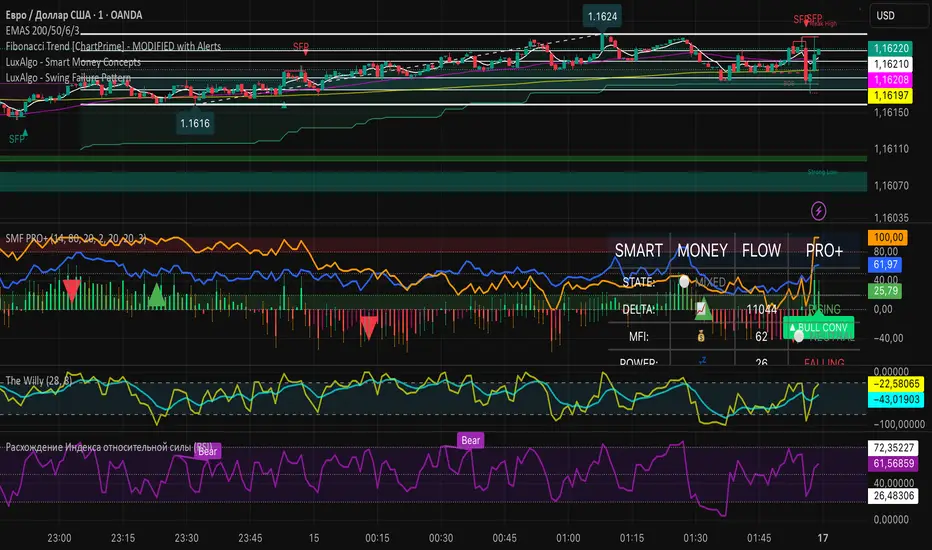
Smart Money Flow PRO + MFI📊 Smart Money Flow PRO + MFI Indicator Components
🔍 CORE CALCULATIONS
Volume Delta Analysis - Bullish/Bearish volume tracking
Cumulative Delta - Running total of volume imbalance
Money Flow Index (MFI) - Volume-weighted RSI (14-period default)
Smart Money Power - Proprietary formula combining:
50% Normalized Delta
20% Simulated Open Interest
30% Normalized MFI
📈 VISUAL DISPLAYS
Oscillator Window:
MFI Line (blue)
Cumulative Delta Line (orange)
Smart Money Power Histogram (colored by trend)
Overbought/Oversold zones (80/20 levels)
Price Chart:
Divergence/Convergence labels
Entry signals with arrows
🎯 SIGNAL DETECTION
Bullish/Bearish Divergences (Triangle markers)
Bullish/Bearish Convergences (Arrow markers)
Overbought/Oversold conditions
High Volume alerts
📊 DATA TABLE (Top-Right Corner)
Market State (STRONG BULLISH/BEARISH, MIXED)
Delta Trend (Rising/Falling)
MFI Status (Overbought/Oversold/Neutral)
Power Trend (Rising/Falling)
Divergence/Convergence status
Entry Signals
⚡ ALERT CONDITIONS
Bullish/Bearish Divergence alerts
Bullish/Bearish Convergence alerts
MFI Overbought/Oversold zone alerts
STRONG BUY/SELL signals (combined conditions)
⚙️ CUSTOMIZATION OPTIONS
Toggle displays (table, chart signals, oscillator signals)
Adjust MFI parameters (length, OB/OS levels)
Volume settings (alert multiplier, lookback)
Divergence settings (lookback, smoothing)
Color schemes for all elements
🎨 VISUAL FEATURES
Professional color-coded displays
Real-time status updates
Multi-timeframe compatible
Clean, organized layout
This indicator provides comprehensive smart money tracking with multiple confirmation layers for high-probability trade setups.
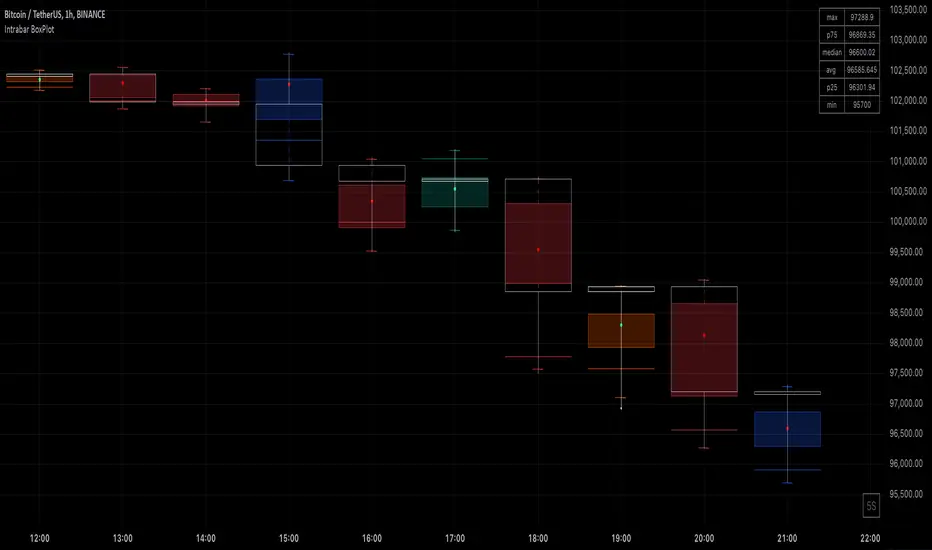
Intrabar BoxPlotThe Intrabar BoxPlot publication highlights an uncommon technique by displaying statistical intrabar Lower Timeframe (LTF) values on the chart.
🔶 USAGE
🔹 Middle 50% Boxes
By showing the middle 50% intrabar values through a box, we can more easily see where the intrabar activity is mainly situated.
The middle 50% intrabar values are referred to from here on as Interquartile range (IQR).
In this example, the successive IQRs form a channel where the price eventually breaks out.
Disproportionately distributed values can give insights which can be used to find potential support/resistance areas.
IQR gaps can give valuable information as well. Potentially, the price can return to these gaps.
Seeing the IQR areas against regular candles gives an alternative image of the underlying price movements.
🔹 Highest volume Price level
The script displays the price level with the highest volume situated, dependable on the user's source setting. Setting the source at 'close' will only display intrabar close values; the same goes for high, low, ...
As seen in the above example, the volume levels can aid in finding support/resistance.
🔹 Median
The location of the median off all intrabar values is displayed as a coloured dot: green when the close price is higher than the opening price and red if otherwise. The median can give valuable insights into price movements.
🔹 Outliers
Medium (white dots) and extreme (white X) outliers, in combination with the IQR box, can help identify potential areas of interest.
🔹 Volume Delta
When there is a discrepancy between the delta volume and direction of the candle, this will be displayed as follows:
Green candle: when the sum of the volume of red intrabars is higher than the sum of the volume of green intrabars, the candle will be coloured orange.
Red candle: when the sum of the volume of green intrabars is higher than the sum of the volume of red intrabars, the candle will be coloured blue.
🔹 Highlight Boxplot only
Probably the easiest way to display boxplot only is by changing the Bar's style to Bars .
🔶 DETAILS
All intrabar values (Lower TimeFrame - LTF) are sorted and evaluated. Values can be close , high , low , ... by selecting this in Settings ( source ).
The middle 50% of all values are displayed as a box; this contains the values between percentile 25 (p25) and percentile 75 (p75). The value of percentile rank 75 means 75% of all values are lower. The value of percentile rank 25 means 25% of all values are lower, or 75% is higher.
The difference between p75 and p25 is also known as Interquartile range (IQR)
IQR is used to check for outliers.
Wiki: Boxplot , Interquartile range
Extreme high: maximum value, higher than p75 + IQR*3
Max outlier high: maximum value, higher than p75 + IQR*1.5 but lower than p75 + IQR*3
Max: maximum value, lower than p75 + IQR*1.5
Min: minimum value, higher than p25 - IQR*1.5
Min outlier low: minimum value, lower than p25 - IQR*1.5 but higher than p25 - IQR*3
Extreme low: minimum value, lower than p25 - IQR*3
Max and min must not be interpreted with the current candle high/low.
🔹 Example: Length of chart-puppets
The following example can make it easier to digest. Forty "chart-puppets" are sorted by their length.
The p25 value is 97
The p50 value is 120
The p75 value is 149
75% of all "chart-puppets" are smaller than p75, and 25% is larger than p75.
50% of all "chart-puppets" are smaller than p50, and 50% is larger than p50 (= median).
25% of all "chart-puppets" are smaller than p25, and 75% is larger than p25.
IQR = 149 - 97 = 52
Extreme outlier limit max: p75 + IQR*3 = 149 + 52*3 = 305
Mild outlier limit max: p75 + IQR*1.5 = 149 + 52*1.5 = 227
Mild outlier limit min: p25 - IQR*1.5 = 97 - 52*1.5 = 19
Extreme outlier limit min: p25 - IQR*3 = 97 - 52*3 = -59
In this example there are no outliers to be found, all values are located between p25 - IQR*1.5 (19) and p75 + IQR*1.5. (227)
🔹 Source settings
Note that results are dependable on the chosen source (settings). When, for example, close is chosen as the source, only intrabar close prices are included. This means a low or high can stretch further then the min or max.
Here we can see different results with different source settings
🔹 LTF settings
When 'Auto' is enabled (Settings, LTF), the LTF will be the nearest possible x times smaller TF than the current TF. When 'Premium' is disabled, the minimum TF will always be 1 minute to ensure TradingView plans lower than Premium don't get an error.
Examples with current Daily TF (when Premium is enabled):
500 : 3 minute LTF
1500 (default): 1 minute LTF
5000: 30 seconds LTF (1 minute if Premium is disabled)
🔶 SETTINGS
Source: Set source at close, high, low,...
🔹 LTF
LTF: LTF setting
Auto + multiple: Adjusts the initial set LTF
Premium: Enable when your TradingView plan is Premium or higher
🔹 Intrabar Delta : Colors, dependable on different circumstances.
Up: Price goes up, with more bullish than bearish intrabar volume.
Up-: Price goes up, with more bearish than bullish intrabar volume.
Down: Price goes down, with more bearish than bullish intrabar volume.
Down+: Price goes down, with more bullish than bearish intrabar volume.
🔹 Table
Show table: Show details at the top right corner
Show TF: Show LTF at the bottom right corner
Text color/table size
See DETAILS for more information
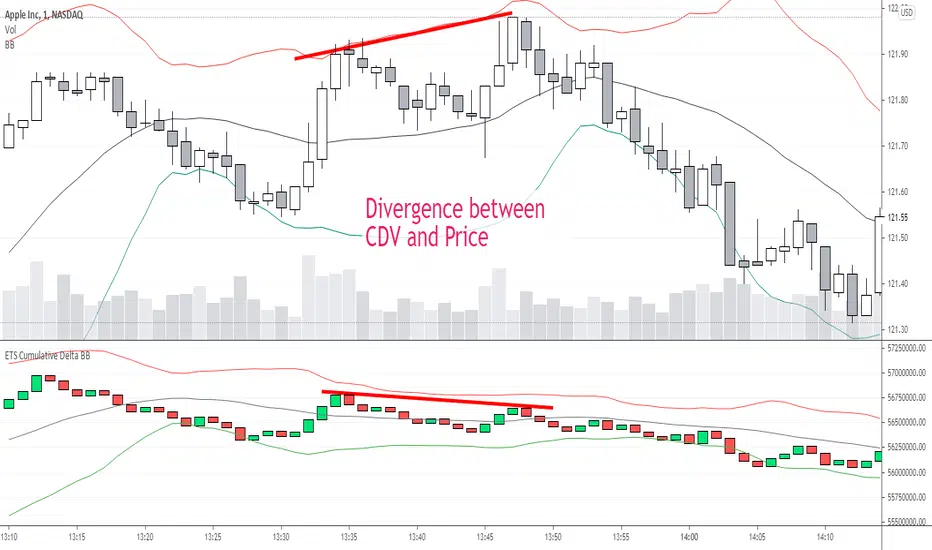
ETS Prox Cumulative Volume Delta BBThis script is based on the work originally done by kprsa for the Monster Cumulative Delta indicator, but adds Bollinger Bands and upgrades it to version 4 from version 1.
It is an approximation of the Cumulative Delta Volume that is usually based on volume differences between market and limit orders, but because that data is not available, this indicator allocates a portion of the volume of a candle to the "upward" and "downward force" of each candle.
The upward force of a "Buy" candle is calculated by the High-Low
The downward force is calculated by (High-Close)+(Open-Low)
"Sell" candles are calculated in the same way just opposite
Total force=up force + down force
Up volume approximation = candle volume * up force/total force
Down volume approximation = candle volume * down force/total force
The result is similar to OBV, but not exactly the same, and allows for a "candle size" which you can't get with On Balance Volume.
I had never used a Cumulative Delta Volume indicator before, but when I started using it myself, it proved very effective when there was a deviation from price. It was also very effective in my opinion when Bollinger Bands was added to assess the standard deviation of the CDV compared to the Bollinger Band of price and looking for areas where the CDV reaction to hitting or getting close to the BB was different.
I hope you find it useful! Of course, it comes with no guarantee of profits or any investing advice whatsoever.
Volume detection trigger📌 Indicator Overview ** Capture a Moment of Market Attention **
This indicator combines abnormal volume (volume explosion) and price reversal patterns to capture a “signal-flare moment.”
In other words, it is designed to detect moments when strong activity enters the market and a trend reversal or the start of a major uptrend/downtrend becomes likely.
✅ Strengths (Short Summary)
Detects meaningful volume spikes rather than random volume increases
Includes bottoming patterns such as long lower wicks & liquidity sweep lows
Filters with EMA alignment / RSI / Stochastic to avoid overheated signals → catches early entries rather than tops
4H/Daily timing filter to detect signals only during high-liquidity market windows
Designed as a rare-signal model for high reliability, not a noisy alert tool
➡ Summary: “The indicator fires only when volume, price structure, momentum, and timing align perfectly at the same moment.”
🎯 How to Use
A signal does not mean you should instantly buy or sell.
Treat it as a sign that “the market’s attention is now concentrated here.”
After a signal appears, check:
Whether price stays above EMA21
Whether there is room to the previous high (upside space)
Whether a minor pullback or retest finds support
🔍 Practical Applications
Use Case Description
Swing Trading Detecting early-stage trend reversals
Day Trading Spotting volume-driven shift points
🧠 Core Summary
📌 “A signal-flare indicator that automatically detects the exact moment when real volume hits the market.”
→ Not a tool to predict direction
→ A tool to recognize timing and concentration zones where major movement is likely to form
⚠ Important Note
A surge in volume or a positive delta does NOT necessarily mean institutions are buying.
The “institution/whale inflow” in the indicator is a model-based estimation, and it cannot identify buyers and sellers with 100% certainty.
Volume, delta, cumulative flow, and VWAP breakout may all imply “strong participation,”
but in some cases, the dominant side may still be sellers, such as:
High volume at a peak (distribution)
Heavy selling into strength
Long upper wick after high delta
Price failing to advance despite massive orders

Trading Blueprint v7 Pro — VWAP-CVD, cPOC Trend MomentumTBv7 Pro is the advanced release of the Trading Blueprint framework — engineered for institutional-style intraday analysis that fuses VWAP location, CVD orderflow, composite profile bias, and momentum curvature into one cohesive system.
Core Framework
VWAP Structure → Adaptive mean anchored to session VWAP with ±1σ / ±2σ deviation envelopes for dynamic equilibrium detection.
vPOC per bar by ruckard ()
Anchored Volume Profile by DGT ()
CVD Orderflow Divergence → Smoothed delta histogram with fractal pivots identifying hidden absorption and exhaustion (patterns (Bull / Bear Div). Cumulative Volume Delta by AustrianTradingMachine )
cPOC Integration (2-Day Composite) by poopsnag (me :)→ Confirms true acceptance or rejection zones across sessions for precision bias alignment.
TMI (Trend Momentum Indicator by TradingRiot()) → Quantifies slope + mean crossover strength, providing actionable momentum confirmation (bullish / bearish support / divergence).
Bias Dashboard → Displays VWAP bias, numerical score, and dynamic color feedback for at-a-glance trade orientation.
Usage Context
Designed for professionals trading 15 m execution inside 1 h / 4 h context. Ideal for VWAP-cPOC location setups, reversion / continuation scalps, and orderflow confirmation using cumulative delta behavior.
🔧 Modules such as RSI / AO are pre-wired and easily activated for full Trading Blueprint confluence mapping.

Order Flow RSI - Price / CVD / OIOrder Flow RSI blends three powerful market perspectives — Price , Cumulative Volume Delta (CVD) , and Open Interest (OI) — into one unified RSI-style oscillator.
It reveals momentum and imbalance across these data streams and highlights situations where participation, liquidity, and positioning disagree — moments that often precede reversals.
What it does
The indicator converts:
Price → RSI (classic momentum),
CVD → RSI (buy/sell pressure balance),
OI → RSI (position expansion/contraction)
…then plots all three RSIs together on the same 0–100 scale.
A fourth Consensus RSI (average of any two or all three) can optionally be shown to simplify the view.
Core logic
CVD engine – based on TradingView’s native volume-delta request.
Modes: Continuous (default, smooth line), Anchored (resets each session), Rolling window.
Open Interest – pulled automatically from the symbol’s “_OI” feed; aligns to chart timeframe for real-time flow.
RSI calculation – standard RSI applied to each data stream, optionally smoothed (SMA / EMA / RMA / WMA / VWMA).
Signals – optional background highlights when:
All three RSIs are overbought (red) or oversold (green), or
Any pair show opposite extremes (e.g., price overbought + OI oversold).
Consensus RSI – arithmetic mean of the selected RSIs, summarizing overall market tone.
Inputs overview
CVD settings: anchor period, lower-TF delta, mode, rolling length
RSI lengths: separate for price, CVD, OI
Smoothing: type + period applied to all RSIs at once
Consensus: choose which RSIs to average
Signals: enable/disable each combination; optional alerts
Levels: adjustable OB/MID/OS (default 70 / 50 / 30)
Visuals: fill between active RSIs, background highlights, level lines, colors in Style tab
How to read it
All 3 overbought (red): broad exhaustion → possible correction
All 3 oversold (green): broad depletion → possible bounce
Opposite pairs: divergence between price and participation
Price↑ but OI↓ (red) → weak rally, fading participation
Price↓ but CVD↑ (green) → hidden accumulation
Combine with structure and volume profile for confirmation.
Notes
Works best on assets with full CVD + OI data (futures, BTC, etc.).
Use Continuous CVD for smooth RSI, Anchored for session analysis.
Smoothing 2–5 EMA is a good starting point to reduce noise.
All styling (colors, line types, thickness) is adjustable in the Style tab.
Limitations & caveats
CVD requires accurate tick/volume/delta data from your data feed. Performance may differ across instruments.
OI availability varies by exchange / symbol. Where OI is absent, pairwise OI signals are not evaluated.
This indicator is a tool — it generates signals of interest, not guaranteed profitable trades. Backtest and combine with your risk rules.
Smoothing introduces lag; longer smoothing reduces noise but delays signals.
Order Flow RSI bridges traditional momentum analysis and order-flow context — giving a multi-dimensional view of when markets are truly stretched or quietly reloading.
Sometimes it works, sometimes it doesn't.

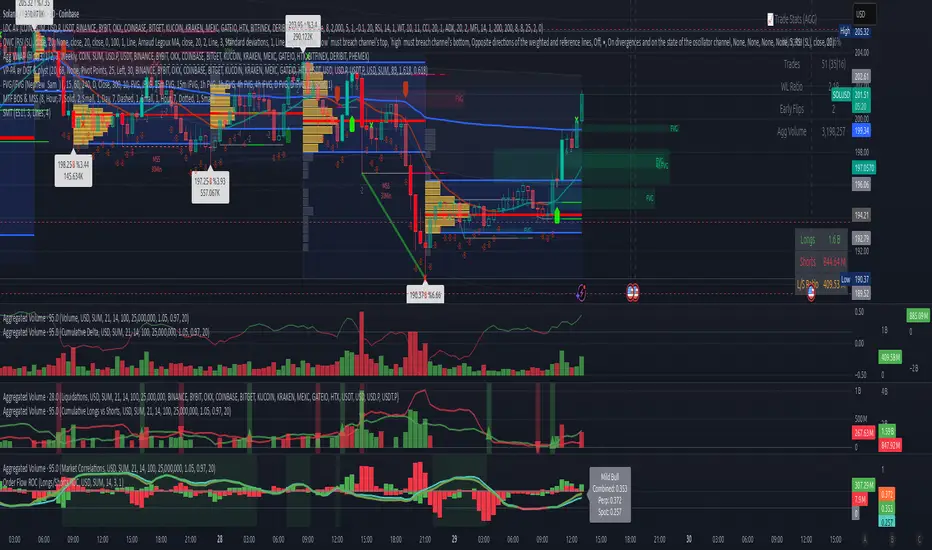
Volume Aggregated Spot & Futures -- Crypto (by plyst & more)📊 Volume Aggregated Spot & Futures - Enhanced Edition
🎯 Overview
Advanced volume aggregation indicator that combines spot and perpetual futures volume across the top 10 cryptocurrency exchanges. This enhanced version builds upon the original work by @HALDRO Project with optimized calculations and expanded functionality.
✨ Key Features
- 📈 Real-time aggregated volume from 10 major exchanges (Binance, Bybit, OKX, Coinbase, Bitget, KuCoin, Kraken, MEXC, Gate.io, HTX)
- 🔄 Multiple visualization modes: Volume, Delta, Cumulative Delta, Spot vs Perp analysis, Liquidations, OBV, and MFI
- 💱 Multi-currency support: Display volume in COIN, USD, or EUR
- 🎨 Clean, single-color bar chart showing total cumulative volume
- 📊 Multiple calculation methods: SUM, AVG, MEDIAN, VARIANCE
- 🎯 Separate spot (USDT, USD, USDC, etc.) and perpetual futures (.P contracts) tracking
🔧 Technical Improvements
✓ Corrected MFI formula for accurate money flow calculations
✓ Optimized volume aggregation logic with proper NA handling
✓ Support for 10 exchanges (up from 9)
✓ Streamlined codebase for better performance
✓ Updated perpetual contract naming conventions (.P format)
📖 Usage
Perfect for analyzing total market volume, identifying liquidation events, tracking buyer/seller pressure through delta analysis, and understanding the spot vs futures market dynamics.
🙏 Credits
Original concept and framework by @HALDRO Project. This version includes mathematical corrections, code optimizations, and expanded exchange support.
⚠️ Note
Aggregated volume is calculated from external exchange data using request.security(). Ensure your plan supports the necessary security calls for optimal performance.
BOCS AdaptiveBOCS Adaptive Strategy - Automated Volatility Breakout System
WHAT THIS STRATEGY DOES:
This is an automated trading strategy that detects consolidation patterns through volatility analysis and executes trades when price breaks out of these channels. Take-profit and stop-loss levels are calculated dynamically using Average True Range (ATR) to adapt to current market volatility. The strategy closes positions partially at the first profit target and exits the remainder at the second target or stop loss.
TECHNICAL METHODOLOGY:
Price Normalization Process:
The strategy begins by normalizing price to create a consistent measurement scale. It calculates the highest high and lowest low over a user-defined lookback period (default 100 bars). The current close price is then normalized using the formula: (close - lowest_low) / (highest_high - lowest_low). This produces values between 0 and 1, allowing volatility analysis to work consistently across different instruments and price levels.
Volatility Detection:
A 14-period standard deviation is applied to the normalized price series. Standard deviation measures how much prices deviate from their average - higher values indicate volatility expansion, lower values indicate consolidation. The strategy uses ta.highestbars() and ta.lowestbars() functions to track when volatility reaches peaks and troughs over the detection length period (default 14 bars).
Channel Formation Logic:
When volatility crosses from a high level to a low level, this signals the beginning of a consolidation phase. The strategy records this moment using ta.crossover(upper, lower) and begins tracking the highest and lowest prices during the consolidation. These become the channel boundaries. The duration between the crossover and current bar must exceed 10 bars minimum to avoid false channels from brief volatility spikes. Channels are drawn using box objects with the recorded high/low boundaries.
Breakout Signal Generation:
Two detection modes are available:
Strong Closes Mode (default): Breakout occurs when the candle body midpoint math.avg(close, open) exceeds the channel boundary. This filters out wick-only breaks.
Any Touch Mode: Breakout occurs when the close price exceeds the boundary.
When price closes above the upper channel boundary, a bullish breakout signal generates. When price closes below the lower boundary, a bearish breakout signal generates. The channel is then removed from the chart.
ATR-Based Risk Management:
The strategy uses request.security() to fetch ATR values from a specified timeframe, which can differ from the chart timeframe. For example, on a 5-minute chart, you can use 1-minute ATR for more responsive calculations. The ATR is calculated using ta.atr(length) with a user-defined period (default 14).
Exit levels are calculated at the moment of breakout:
Long Entry Price = Upper channel boundary
Long TP1 = Entry + (ATR × TP1 Multiplier)
Long TP2 = Entry + (ATR × TP2 Multiplier)
Long SL = Entry - (ATR × SL Multiplier)
For short trades, the calculation inverts:
Short Entry Price = Lower channel boundary
Short TP1 = Entry - (ATR × TP1 Multiplier)
Short TP2 = Entry - (ATR × TP2 Multiplier)
Short SL = Entry + (ATR × SL Multiplier)
Trade Execution Logic:
When a breakout occurs, the strategy checks if trading hours filter is satisfied (if enabled) and if position size equals zero (no existing position). If volume confirmation is enabled, it also verifies that current volume exceeds 1.2 times the 20-period simple moving average.
If all conditions are met:
strategy.entry() opens a position using the user-defined number of contracts
strategy.exit() immediately places a stop loss order
The code monitors price against TP1 and TP2 levels on each bar
When price reaches TP1, strategy.close() closes the specified number of contracts (e.g., if you enter with 3 contracts and set TP1 close to 1, it closes 1 contract). When price reaches TP2, it closes all remaining contracts. If stop loss is hit first, the entire position exits via the strategy.exit() order.
Volume Analysis System:
The strategy uses ta.requestUpAndDownVolume(timeframe) to fetch up volume, down volume, and volume delta from a specified timeframe. Three display modes are available:
Volume Mode: Shows total volume as bars scaled relative to the 20-period average
Comparison Mode: Shows up volume and down volume as separate bars above/below the channel midline
Delta Mode: Shows net volume delta (up volume - down volume) as bars, positive values above midline, negative below
The volume confirmation logic compares breakout bar volume to the 20-period SMA. If volume ÷ average > 1.2, the breakout is classified as "confirmed." When volume confirmation is enabled in settings, only confirmed breakouts generate trades.
INPUT PARAMETERS:
Strategy Settings:
Number of Contracts: Fixed quantity to trade per signal (1-1000)
Require Volume Confirmation: Toggle to only trade signals with volume >120% of average
TP1 Close Contracts: Exact number of contracts to close at first target (1-1000)
Use Trading Hours Filter: Toggle to restrict trading to specified session
Trading Hours: Session input in HHMM-HHMM format (e.g., "0930-1600")
Main Settings:
Normalization Length: Lookback bars for high/low calculation (1-500, default 100)
Box Detection Length: Period for volatility peak/trough detection (1-100, default 14)
Strong Closes Only: Toggle between body midpoint vs close price for breakout detection
Nested Channels: Allow multiple overlapping channels vs single channel at a time
ATR TP/SL Settings:
ATR Timeframe: Source timeframe for ATR calculation (1, 5, 15, 60, etc.)
ATR Length: Smoothing period for ATR (1-100, default 14)
Take Profit 1 Multiplier: Distance from entry as multiple of ATR (0.1-10.0, default 2.0)
Take Profit 2 Multiplier: Distance from entry as multiple of ATR (0.1-10.0, default 3.0)
Stop Loss Multiplier: Distance from entry as multiple of ATR (0.1-10.0, default 1.0)
Enable Take Profit 2: Toggle second profit target on/off
VISUAL INDICATORS:
Channel boxes with semi-transparent fill showing consolidation zones
Green/red colored zones at channel boundaries indicating breakout areas
Volume bars displayed within channels using selected mode
TP/SL lines with labels showing both price level and distance in points
Entry signals marked with up/down triangles at breakout price
Strategy status table showing position, contracts, P&L, ATR values, and volume confirmation status
HOW TO USE:
For 2-Minute Scalping:
Set ATR Timeframe to "1" (1-minute), ATR Length to 12, TP1 Multiplier to 2.0, TP2 Multiplier to 3.0, SL Multiplier to 1.5. Enable volume confirmation and strong closes only. Use trading hours filter to avoid low-volume periods.
For 5-15 Minute Day Trading:
Set ATR Timeframe to match chart or use 5-minute, ATR Length to 14, TP1 Multiplier to 2.0, TP2 Multiplier to 3.5, SL Multiplier to 1.2. Volume confirmation recommended but optional.
For Hourly+ Swing Trading:
Set ATR Timeframe to 15-30 minute, ATR Length to 14-21, TP1 Multiplier to 2.5, TP2 Multiplier to 4.0, SL Multiplier to 1.5. Volume confirmation optional, nested channels can be enabled for multiple setups.
BACKTEST CONSIDERATIONS:
Strategy performs best during trending or volatility expansion phases
Consolidation-heavy or choppy markets produce more false signals
Shorter timeframes require wider stop loss multipliers due to noise
Commission and slippage significantly impact performance on sub-5-minute charts
Volume confirmation generally improves win rate but reduces trade frequency
ATR multipliers should be optimized for specific instrument characteristics
COMPATIBLE MARKETS:
Works on any instrument with price and volume data including forex pairs, stock indices, individual stocks, cryptocurrency, commodities, and futures contracts. Requires TradingView data feed that includes volume for volume confirmation features to function.
KNOWN LIMITATIONS:
Stop losses execute via strategy.exit() and may not fill at exact levels during gaps or extreme volatility
request.security() on lower timeframes requires higher-tier TradingView subscription
False breakouts inherent to breakout strategies cannot be completely eliminated
Performance varies significantly based on market regime (trending vs ranging)
Partial closing logic requires sufficient position size relative to TP1 close contracts setting
RISK DISCLOSURE:
Trading involves substantial risk of loss. Past performance of this or any strategy does not guarantee future results. This strategy is provided for educational purposes and automated backtesting. Thoroughly test on historical data and paper trade before risking real capital. Market conditions change and strategies that worked historically may fail in the future. Use appropriate position sizing and never risk more than you can afford to lose. Consider consulting a licensed financial advisor before making trading decisions.
ACKNOWLEDGMENT & CREDITS:
This strategy is built upon the channel detection methodology created by AlgoAlpha in the "Smart Money Breakout Channels" indicator. Full credit and appreciation to AlgoAlpha for pioneering the normalized volatility approach to identifying consolidation patterns and sharing this innovative technique with the TradingView community. The enhancements added to the original concept include automated trade execution, multi-timeframe ATR-based risk management, partial position closing by contract count, volume confirmation filtering, and real-time position monitoring.

Intrabar DistributionThe Intrabar Distribution publication is an extension of the Intrabar BoxPlot publication. Besides a boxplot, it showcases price and volume distribution using intrabar Lower Timeframe (LTF) values (close) which can be displayed on the chart or in a separate pane.
🔶 USAGE
Intrabar Distribution has several features, users can display:
Recent candle for comparison against the other features
Boxplot of recent candle
Price distribution (optionally displayed as a curve)
Volume distribution
🔹 Recent candle / Boxplot
The middle 50% intrabar close values (Interquartile range, or IQR) are shown as a box, where the upper limit is percentile 75 (p75), and the lower limit is percentile 25 (p25). The dashed lines show the addition/subtraction of 1.5*IQR. All values out of range are considered outliers. They are displayed as white dots within the IQR*1.5 range or white X's when beyond the IQR*3 range (extreme outliers).
By showing the middle 50% intrabar values through a box, we can more easily see where the intrabar activity is mainly situated.
Note in the example above an upward-directed candle with a negative volume delta, displayed as a red box and dot (see further).
As seen in the following example, compared against the recent candle (grey candle at the left), most of the intrabar activity lies just beneath the opening price.
Note that results will be more accurate when more data is available, which can be done by making the difference between the current timeframe and the intrabar timeframe large enough.
🔹 Price / Volume distribution
The price and volume distribution can be helpful for highlighting areas of interest.
Here, we can see two areas where intrabar closing prices are mainly positioned.
The following example shows three successive bars. The recent bar is displayed on the left side, together with the volume distribution. The boxplot and price distribution are displayed on the right.
You can see the difference between volume and price distribution.
At the first bar, most price activity is at the top, while most of the volume was generated at the bottom; in other words, the price got briefly in the bottom region, with high volume before it returned.
At the second bar, price and volume are relatively equally distributed, which fits for indecisiveness.
The third bar shows more volume at a higher region; most intrabar closing prices are above the closing price.
Following example shows the same with 'Curve shaped' enabled (Settings: 'Price Distribution')
When 'Curve shaped' is enabled, lines/labels are shown with the standard deviation distance.
A blue 'guide line' can be enabled for easier interpretation.
🔹 Volume Delta
When there is a discrepancy between the delta volume and direction of the candle, this will be displayed as follows:
Red candle: when the sum of the volume of green intrabars is higher than the sum of the volume of red intrabars, the 'mean dot' will be coloured green.
Green candle: when the sum of the volume of red intrabars is higher than the sum of the volume of green intrabars, the 'mean dot' will be coloured red.
🔶 DETAILS
The intrabar values are sorted and split in parts/sections. The number of values in each section is displayed as a white line
The same principle applies to volume distribution, where the sum of volume per section is displayed as an orange area.
The boxplot displays several price values
Last close price
Highest / lowest intrabar close price
Median
p25 / p75
🔹 LTF settings
When 'Auto' is enabled (Settings, LTF), the LTF will be the nearest possible x times smaller TF than the current TF. When 'Premium' is disabled, the minimum TF will always be 1 minute to ensure TradingView plans lower than Premium don't get an error.
Examples with current Daily TF (when Premium is enabled):
500 : 3 minute LTF
1500 (default): 1 minute LTF
5000: 30 seconds LTF (1 minute if Premium is disabled)
🔶 SETTINGS
Location: Chart / Pane (when pane is opted, move the indicator to a separate pane as well)
Parts: divides the intrabar close values into parts/sections
Offset: offsets every drawing at once
Width: width of drawings, only applicable on "location: chart"
Label size: size of price labels
🔹 LTF
LTF: LTF setting
Auto + multiple: Adjusts the initial set LTF
Premium: Enable when your TradingView plan is Premium or higher
🔹 Current Bar
Display toggle + color setting
Offset: offsets only the 'Current Bar' drawing
🔹 Intrabar Boxplot
Display toggle + Colors, dependable on different circumstances.
Up: Price goes up, with more bullish than bearish intrabar volume.
Up-: Price goes up, with more bearish than bullish intrabar volume.
Down: Price goes down, with more bearish than bullish intrabar volume.
Down+: Price goes down, with more bullish than bearish intrabar volume.
Offset: offsets only the 'Boxplot' drawing
🔹 Price distribution
Display toggle + Color.
Curve Shaped
Guide Lines: Display 2 blue lines
Display Price: Show price of 'x' standard deviation
Offset: offsets only the 'Price distribution' drawing
Label size: size of price labels (standard deviation)
🔹 Volume distribution
Display toggle + Color.
Offset: offsets only the 'Volume distribution' drawing
🔹 Table
Show TF: Show intrabar Timeframe.
Textcolor
Size Table: Text Size
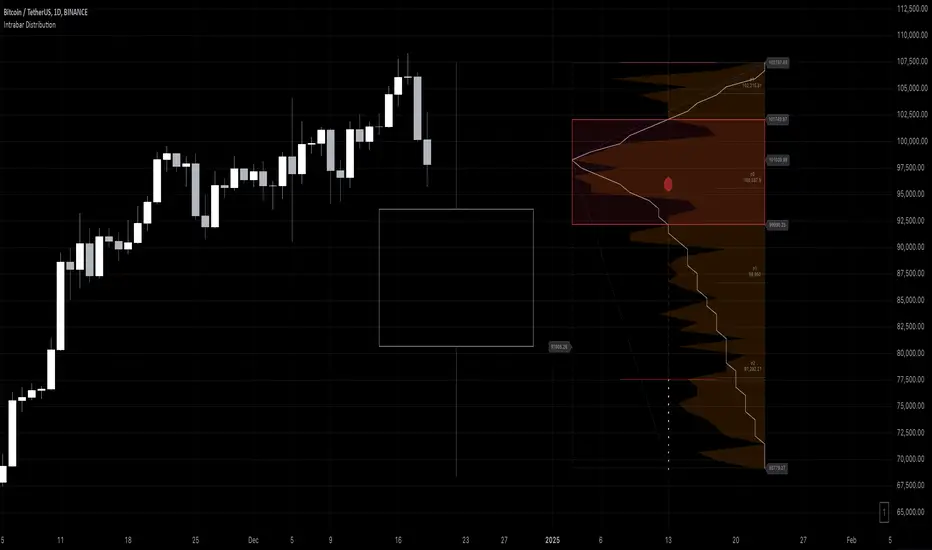
Bullish/Bearish VolumeThe "Bullish/Bearish Volume" indicator helps traders identify discrepancies between price movement and trading volumes. Sometimes the price trends in one direction while trading volumes indicate opposing intentions among market participants. This indicator aims to identify such divergences, assisting traders in making more informed and balanced trading decisions.
Key features:
1. Directional Volume Differences: The indicator calculates volumes by separating them into two main categories: buying and selling. When the closing price is higher than the opening price, buying volume is shown in green, while selling volume is shown in red when the closing price is lower than the opening price. This accurate classification helps identify which volume type predominates in the current interval.
2. Histograms by Fixed Time Intervals: Collecting data from a fixed time interval (1 minute), the indicator analyzes and sums up buying and selling volumes regardless of the selected chart timeframe. This provides a more detailed market view, allowing traders to accurately gauge sentiment within any chosen timeframe.
3. Total Volume: The indicator aggregates buying and selling volumes, representing total trading activity in gray transparent bars. This gives traders a clear visual representation of overall volume activity in the market for a selected period.
4. Volume Delta and its Moving Average: The volume delta (the difference between buying and selling volumes) is highlighted in blue, allowing for monitoring shifts in the balance of buying and selling power. Additionally, the indicator includes a moving average of the delta, shown as a blue line, to smooth out short-term fluctuations and help traders easily identify long-term trends in volume shifts.
5. Volume Volatility: A histogram representing volume volatility offers insight into trading activity variability, uncovering abnormal spikes or lulls in market dynamics.
Bullish/Bearish Volume is a powerful tool that can break down market flows into understandable signals, enabling traders to better recognize imbalances and make informed decisions.

Divergence for Many Panel (D4MP+)Divergence for Many Panel (D4MP+)
This Divergence for Many Panel indicator is built upon the realtme divergence drawing code originally authored by LonesomeTheBlue, now in the form of a panel indicator.
The available oscillators, hand picked for their ability to identify high quality divergences currently include:
- Ultimate Oscillator (UO)
- True Strength Index (TSI)
- Money Flow Index (MFI)
- Relative Strength Index (RSI)
- Stochastic RSI
- Time Segmented Volume (TSV)
- Cumulative Delta Volume (CDV)
Note : this list of available oscillators may be added to or altered at a later date.
The indicator includes the following features:
- Ability to select any of the above oscillators
- Optional divergence lines drawn directly onto the oscillator in realtime .
- Configurable alerts to notify you when divergences occur.
- Configurable pivot lookback periods to fine tune the divergences drawn in order to suit different trading styles and timeframes, including the ability to enable automatic adjustment of pivot period per chart timeframe.
- Background colouring option to indicate when the selected oscillator has crossed above or below its centerline.
- Alternate timeframe feature allows you to configure the oscillator to use data from a different timeframe than the chart it is loaded on.
- Oscillator name label, so you can clearly see which oscillator is selected, in the case you have multiple loaded onto a chart.
- Optional adjustable range bands.
- Automatic adjustment of line colours, centerlines and range band levels on a per oscillator basis by default.
- Ability to customise the colours of each of the oscillators.
What is the Ultimate Oscillator ( UO )?
“The Ultimate Oscillator indicator (UO) indicator is a technical analysis tool used to measure momentum across three varying timeframes. The problem with many momentum oscillators is that after a rapid advance or decline in price, they can form false divergence trading signals. For example, after a rapid rise in price, a bearish divergence signal may present itself, however price continues to rise. The ultimate Oscillator attempts to correct this by using multiple timeframes in its calculation as opposed to just one timeframe which is what is used in most other momentum oscillators.”
What is the True Strength Index ( TSI )?
"The true strength index (TSI) is a technical momentum oscillator used to identify trends and reversals. The indicator may be useful for determining overbought and oversold conditions, indicating potential trend direction changes via centerline or signal line crossovers, and warning of trend weakness through divergence."
What is the Money Flow Index ( MFI )?
“The Money Flow Index ( MFI ) is a technical oscillator that uses price and volume data for identifying overbought or oversold signals in an asset. It can also be used to spot divergences which warn of a trend change in price. The oscillator moves between 0 and 100. Unlike conventional oscillators such as the Relative Strength Index ( RSI ), the Money Flow Index incorporates both price and volume data, as opposed to just price. For this reason, some analysts call MFI the volume-weighted RSI .”
What is the Relative Strength Index ( RSI )?
"The relative strength index (RSI) is a momentum indicator used in technical analysis. RSI measures the speed and magnitude of a security's recent price changes to evaluate overvalued or undervalued conditions in the price of that security. The RSI can do more than point to overbought and oversold securities. It can also indicate securities that may be primed for a trend reversal or corrective pullback in price. It can signal when to buy and sell. Traditionally, an RSI reading of 70 or above indicates an overbought situation. A reading of 30 or below indicates an oversold condition. It is also commonly used to identify divergences."
What is the Stochastic RSI (StochRSI)?
"The Stochastic RSI (StochRSI) is an indicator used in technical analysis that ranges between zero and one (or zero and 100 on some charting platforms) and is created by applying the Stochastic oscillator formula to a set of relative strength index (RSI) values rather than to standard price data. Using RSI values within the Stochastic formula gives traders an idea of whether the current RSI value is overbought or oversold. The StochRSI oscillator was developed to take advantage of both momentum indicators in order to create a more sensitive indicator that is attuned to a specific security's historical performance rather than a generalized analysis of price change."
What Is Time Segmented Volume?
"Time segmented volume (TSV) is a technical analysis indicator developed by Worden Brothers Inc. that segments a stock's price and volume according to specific time intervals. The price and volume data is then compared to uncover periods of accumulation (buying) and distribution (selling)."
What is Cumulative Volume Delta ( CDV )?
"The CDV analyses the net buying at market price and net selling at market price. This means, that volume delta is measuring whether it is the buyers or sellers that are more aggressive in taking the current market price. It measures the degree of intent by buyers and sellers, which can be used to indicate who is more dominant. The CDV can be used to help identify possible trends and also divergences"
What are divergences?
Divergence is when the price of an asset is moving in the opposite direction of a technical indicator, such as an oscillator, or is moving contrary to other data. Divergence warns that the current price trend may be weakening, and in some cases may lead to the price changing direction.
There are 4 main types of divergence, which are split into 2 categories;
regular divergences and hidden divergences. Regular divergences indicate possible trend reversals, and hidden divergences indicate possible trend continuation.
Regular bullish divergence: An indication of a potential trend reversal, from the current downtrend, to an uptrend.
Regular bearish divergence: An indication of a potential trend reversal, from the current uptrend, to a downtrend.
Hidden bullish divergence: An indication of a potential uptrend continuation.
Hidden bearish divergence: An indication of a potential downtrend continuation.
Setting alerts.
With this indicator you can set alerts to notify you when any/all of the above types of divergences occur, on any chart timeframe you choose.
Configurable pivot periods.
You can adjust the default pivot periods to suit your prefered trading style and timeframe. If you like to trade a shorter time frame, lowering the default lookback values will make the divergences drawn more sensitive to short term price action.
How do traders use divergences in their trading?
A divergence is considered a leading indicator in technical analysis , meaning it has the ability to indicate a potential price move in the short term future.
Hidden bullish and hidden bearish divergences, which indicate a potential continuation of the current trend are sometimes considered a good place for traders to begin, since trend continuation occurs more frequently than reversals, or trend changes.
When trading regular bullish divergences and regular bearish divergences, which are indications of a trend reversal, the probability of it doing so may increase when these occur at a strong support or resistance level . A common mistake new traders make is to get into a regular divergence trade too early, assuming it will immediately reverse, but these can continue to form for some time before the trend eventually changes, by using forms of support or resistance as an added confluence, such as when price reaches a moving average, the success rate when trading these patterns may increase.
Typically, traders will manually draw lines across the swing highs and swing lows of both the price chart and the oscillator to see whether they appear to present a divergence, this indicator will draw them for you, quickly and clearly, and can notify you when they occur.
Disclaimer : This script includes code from several stock indicators by Tradingview as well as the Divergence for Many Indicators v4 by LonesomeTheBlue. With special thanks.
