Bull Vs Bear Visible Range VP [Kioseff Trading]Hello!
This Script “Bull vs Bear Visible Range VP” Calculates Bull & Bear Volume Profiles for the Visible Range Alongside a Delta Ladder for the Visible Period!
Features
Volume Profile Anchored to Visible Range
Delta Ladder Anchored to Visible Range
Bull vs Bear Profiles!
Standard Poc and Value Area Lines, in Addition to Separated POCs and Value Area Lines for Bull Profiles and Bear Profiles
Configurable Value Area Target
Curved Profiles
Up to 9999 Profile Rows per Visible Range
Stylistic Options for Profiles
This Script Generates Bull vs. Bear Volume Profiles for the Visible Range!
Up to 9999 Volume Profile Levels (Price Levels) Can Be Calculated for Each Profile, Thanks to the New Polyline Feature, Allowing For Less Aggregation / More Precision of Volume at Price and Volume Delta.
Bull vs Bear Profiles
The Image Above Shows Primary Functionality!
Green Profiles = Buying Volume
Red Profiles = Selling Volume
Bullish & Bearish Pocs for the Visible Range Are Displayable!
Profiles Can Be Anchored on the Left Side for a More Traditional Look.
The indicator is robust enough to calculate on "small price periods", or for a price period spanning your entire chart fully zoomed out!
That’s About It :D
This Indicator Is Part of a Series Titled “Bull vs. Bear” - A Suite of Profile-Like Indicators I Will Be Releasing Over Coming Days. Thanks for Checking This Out!
If You Have Any Suggestions Please Feel Free to Share!
Cari skrip untuk "VOLUME DELTA"

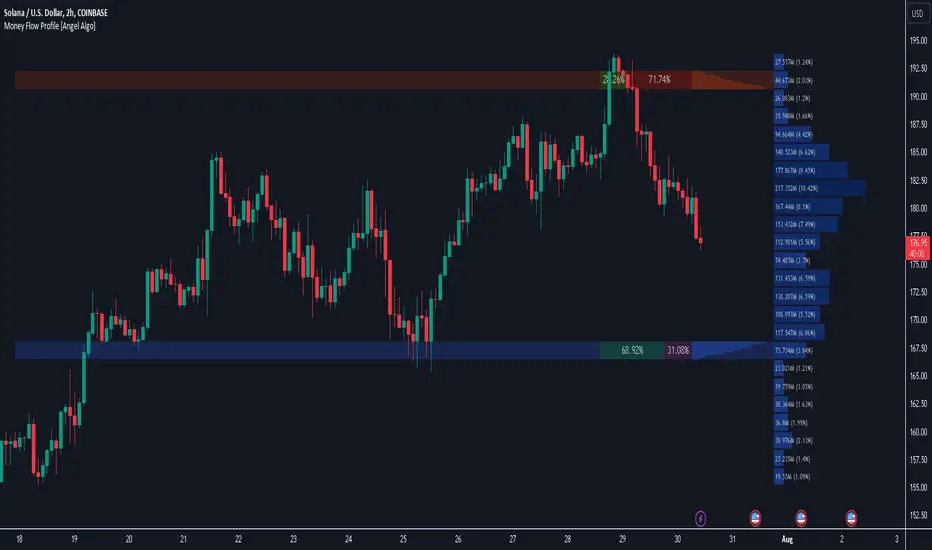
Money Flow Profile [Angel Algo]Money Flow Profile
Overview
This indicator is designed to analyze trading activity and identify key supply and demand zones using volume and money flow data. It is an advanced tool for traders who want to incorporate volume profile analysis into their trading strategy, enhancing their ability to spot potential reversal zones and understand market sentiment.
Features
1. Customizable Lookback Period
Description: Users can specify the number of bars to consider in the volume profile calculation, allowing for flexible analysis over different periods.
Functionality: This setting adjusts the depth of historical data analyzed, enabling traders to tailor the indicator to various trading styles and timeframes.
2. Row Size Configuration
Description: This input determines the number of rows (or price levels) displayed in the volume profile.
Functionality: By adjusting the row size, traders can get a more granular or more generalized view of trading activity at different price levels.
3. Data Source Selection
Options: Volume, Money Flow
Description: Traders can choose between using traditional volume data or money flow for the volume profile calculation.
Functionality: Money flow incorporates both price and volume to give a more comprehensive view of market buying and selling pressure, while volume focuses solely on trading activity.
Volume:
Money Flow:
4. Color Gradient for Volume Intensity
Description: The script allows setting maximum and minimum colors to create a gradient that visually represents the intensity of trading activity.
Functionality: This visual aid helps traders quickly identify areas of high and low trading activity, enhancing the interpretability of the volume profile.
Advanced Analysis: Supply and Demand Zones
1. Sentiment Analysis-Based Zoning
Description: The script analyzes the volume profile bars above and below the current close price to detect zones with significant buying or selling pressure.
Methodology:
Supply Zones: Identified by analyzing bars above the current close and finding the area with the highest selling pressure, indicated by volume delta.
Demand Zones: Identified by analyzing bars below the current close and finding the area with the highest buying pressure.
2. Volume Delta Calculation
Description: Volume delta, the difference between buy and sell volumes, is used to gauge the strength of buying or selling pressure at each price level.
Functionality: This calculation helps pinpoint the most significant supply and demand zones, providing traders with potential entry and exit points based on market sentiment.
Usage Scenario
This indicator is particularly useful for traders who focus on intraday trading, swing trading, or any strategy that benefits from understanding volume dynamics and sentiment at specific price levels. It allows traders to visually assess which levels are likely to act as resistance or support, based on historical trading activity and current market sentiment.
Conclusion
By integrating both traditional and innovative analytical methods, this Indicator offers a powerful tool for market analysis. Its flexibility and depth provide traders with valuable insights into market dynamics.
DarkPool's Dashboard v2 DarkPool's Dashboard v2 is a comprehensive "Heads-Up Display" (HUD) designed to aggregate critical market data into a single, customizable table overlaid on the price chart. Its primary goal is to declutter the trading workspace by removing the need for multiple separate indicator panes (like RSI, MACD, and Volume below the chart).
The core of the system is a composite Momentum Score, which calculates a value between -100 and +100 based on a weighted average of RSI, MACD, Stochastic, and Rate of Change (ROC). This score drives the main "Signal" output (e.g., STRONG BUY, HOLD, SELL). Additionally, the dashboard integrates a suite of volume analysis tools—including VWAP, OBV, and Volume Delta—alongside volatility and trend filters to provide a complete market health check at a glance.
Key Features
Composite Momentum Score: A unified metric combining four oscillators to gauge the true strength of the move.
Volume Intelligence: Monitors Relative Volume (RVOL), On-Balance Volume (OBV), Volume Delta, and VWAP status.
Trend & Filter Engine: Visualizes trend direction using EMAs and filters signals based on Volatility (ATR) and Trend Strength (EMA Separation).
Dynamic UI: A fully scalable and customizable table that can be positioned anywhere on the screen, with options to toggle specific data rows on or off.
Alert System: Integrated alerts for Volume Spikes, Divergences, and VWAP crossovers.
How to Use
1. Reading the Main Signal The top rows of the dashboard provide the immediate trade bias:
Signal: Displays text such as "STRONG BUY," "BUY," "HOLD," "SELL," or "STRONG SELL."
Momentum Score: A numeric value next to the signal.
> 50: Strong Bullish Momentum.
20 to 50: Moderate Bullish Momentum.
-20 to 20: Neutral / Hold (Chop).
<-20: Bearish Momentum.
2. Volume Analysis
Volume Bar: Visualizes the current volume relative to the Moving Average.
Spike: If the bar turns Orange/Yellow, a Volume Spike (default 2x average) has occurred.
VWAP: Indicates if the price is trading "Above" or "Below" the Volume Weighted Average Price.
Money Flow (MFI): Checks for institutional buying/selling pressure. "OB" means Overbought, "OS" means Oversold.
3. Trend & Volatility
Trend: Shows "UP" or "DOWN" based on Fast/Slow EMA crossovers.
Volatility: Measures the daily range. "HIGH" volatility suggests expansion, while "LOW" suggests compression (potential breakout pending).
4. Filtering Bad Signals The dashboard includes an "ATR Filter" and "Trend Confirmation" logic.
If the market is moving sideways (low ATR), the dashboard may default to "HOLD" or "NEUTRAL" even if oscillators are crossing, preventing false entries during consolidation.
Configuration Settings
Dashboard Settings
Table Position/Width/Scale: adjust the size and location of the table to fit your screen resolution (e.g., increase scale for 4K monitors).
Colors/Transparency: Customize the background and text colors to match your chart theme.
Indicator Settings
Oscillators: Adjust lengths for RSI, MACD, and Stochastic to tune sensitivity.
Volume: Enable or disable specific volume metrics like OBV or Delta.
Display Options: You can toggle specific rows off (e.g., turn off "ADX" or "SMA" if you do not use them) to compact the table.
Filter Settings
Enable ATR Filter: Toggles volatility filtering.
Trend Confirmation Bars: How many bars the trend must persist before the dashboard flips its bias (helps avoid fake-outs).
Disclaimer This indicator is provided for educational and informational purposes only. It does not constitute financial advice, investment recommendations, or a guarantee of future results. Trading cryptocurrencies and financial markets involves a high level of risk. Always perform your own due diligence before making any trading decisions.

Z-Score Volume with CVD Clustering Script Title:
Z-Score Volume with CVD Clustering & NY VWAP
📘 Description:
This indicator combines statistical volume analysis with order flow confirmation to detect high-probability trade zones and volume-based divergences.
📌 Components:
Z-Score of Volume: Identifies statistically significant volume surges or drops relative to a moving average baseline.
Cumulative Volume Delta (CVD): Gauges net buying vs. selling pressure using high-frequency bid/ask delta.
K-Means Clustering: Applies clustering logic to classify each bar into:
Cluster 2 – Strong Bullish: Z-Score and CVD both strong
Cluster 1 – Divergence / Bull Trap: Z-Score high, but weak CVD
Cluster 0 – Neutral / Noise: No clear alignment
Anchored VWAP (NY Session Open): Confirms market structure and institutional trend bias from 9:30 AM ET forward.
🎯 Suggested Applications:
✅ 1. Trend Continuation Entries (Add-ons):
Look to add to positions when:
Cluster 2 signal occurs
Price is above the NY session VWAP
Price structure has broken out of prior day high/low or range
⚠️ 2. Divergence Detection (Fade Traps):
Cluster 1 signals a bearish divergence (e.g., high volume but weak CVD).
Especially useful when price is failing to stay above VWAP.
Useful for early exits or reversal setups.
📊 3. Volume Profile Confirmation:
Combine with fixed or session-based volume profile tools.
Use Z-Score clusters to confirm volume spikes into low-volume nodes (LVNs) or during imbalance transitions.
📍 4. VWAP Structure Confirmation:
Anchored VWAP acts as a dynamic reference point.
Helps confirm acceptance vs. rejection zones at key institutional levels.
📈 Visuals & Alerts:
Color-coded volume bars show intensity of Z-Score & CVD confluence
CVD Line plots real-time delta bias with green/red coloring
Cluster-based shape markers highlight key bars for actionable signals
Optional: Add alerts for Cluster 2 above VWAP or Cluster 1 below VWAP
⚙️ Customization Options:
Adjustable Z-Score length
Custom anchor timeframe for CVD (e.g., 1D or sessions)
Adjustable max lookback depth
Toggle VWAP inclusion
Extendable to include additional filters: RSI, structure break alerts, etc.
🔧 Ideal Use Cases:
NY session intraday traders (ES, NQ, CL, 6E, FX pairs)
Breakout traders wanting order flow confirmation
Mean reversion traders spotting fake moves
Volume-based scalpers looking for edge on short-term order imbalance

Volumetric Expansion/Contraction### Indicator Title: Volumetric Expansion/Contraction
### Summary
The Volumetric Expansion/Contraction (PCC) indicator is a comprehensive momentum oscillator designed to identify high-conviction price moves. Unlike traditional oscillators that only look at price, the PCC integrates four critical dimensions of market activity: **Price Change**, **Relative Volume (RVOL)**, **Cumulative Volume Delta (CVD)**, and **Average True Range (ATR)**.
Its primary purpose is to help traders distinguish between meaningful, volume-backed market expansions and noisy, unsustainable price action. It gives more weight to moves that occur in a controlled, low-volatility environment, highlighting potential starts of new trends or significant shifts in market sentiment.
### Key Concepts & Purpose
The indicator's unique formula synthesizes the following concepts:
1. **Price Change:** Measures the magnitude and direction of the primary move.
2. **Relative Volume (RVOL):** Confirms that the move is backed by significant volume compared to its recent average, indicating institutional participation.
3. **Cumulative Volume Delta (CVD):** Measures the underlying buying and selling pressure, confirming that the price move is aligned with the net flow of market orders.
4. **Inverse Volatility (ATR):** This is the indicator's unique twist. It normalizes the signal by the inverse of the Average True Range. This means the indicator's value is **amplified** when volatility (ATR) is low (signifying a controlled, confident expansion) and **dampened** when volatility is high (filtering out chaotic, less predictable moves).
The goal is to provide a single, easy-to-read oscillator that signals when price, volume, and order flow are all in alignment, especially during a breakout from a period of contraction.
### Features
* **Main Oscillator Line:** A single line plotted in a separate pane that represents the calculated strength of the volumetric expansion or contraction.
* **Zero Line:** A dotted reference line to easily distinguish between bullish (above zero) and bearish (below zero) regimes.
* **Visual Threshold Zones:** The background automatically changes color to highlight periods of significant strength:
* **Bright Green:** Indicates a "Strong Up Move" when the oscillator crosses above the user-defined upper threshold.
* **Bright Fuchsia:** Indicates a "Strong Down Move" when the oscillator crosses below the user-defined lower threshold.
### Configurable Settings & Filters
The indicator is fully customizable to allow for extensive testing and adaptation to different assets and timeframes.
#### Main Calculation Inputs
* **Price Change Lookback:** Sets the period for calculating the primary price change.
* **CVD Normalization Length:** The lookback period for normalizing the Cumulative Volume Delta.
* **RVOL Avg Volume Length:** The lookback for the simple moving average of volume, used to calculate RVOL.
* **RVOL Normalization Length:** The lookback period for normalizing the RVOL score.
* **ATR Length & Normalization Length:** Sets the periods for calculating the ATR and its longer-term average for normalization.
#### Weights
* Fine-tune the impact of each core component on the final calculation, allowing you to emphasize what matters most to your strategy (e.g., give more weight to CVD or RVOL).
#### External Market Filter (Powerful Feature)
* **Enable SPY/QQQ Filter for Up Moves?:** A checkbox to activate a powerful regime filter.
* **Symbol:** A dropdown to choose whether to filter signals based on the trend of **SPY** or **QQQ**.
* **SMA Period:** Sets the lookback period for the Simple Moving Average (default is 50).
* **How it works:** When enabled, this filter will **only allow "Strong Up Move" signals to appear if the chosen symbol (SPY or QQQ) is currently trading above its specified SMA**. This is an excellent tool for aligning your signals with the broader market trend and avoiding bullish entries in a bearish market.
#### Visuals
* **Upper/Lower Threshold:** Allows you to define what level the oscillator must cross to trigger the colored background zones, letting you customize the indicator's sensitivity.
***
**Disclaimer:** This tool is designed for market analysis and confluence. It is not a standalone trading system. Always use this indicator in conjunction with your own trading strategy, risk management, and other forms of analysis.

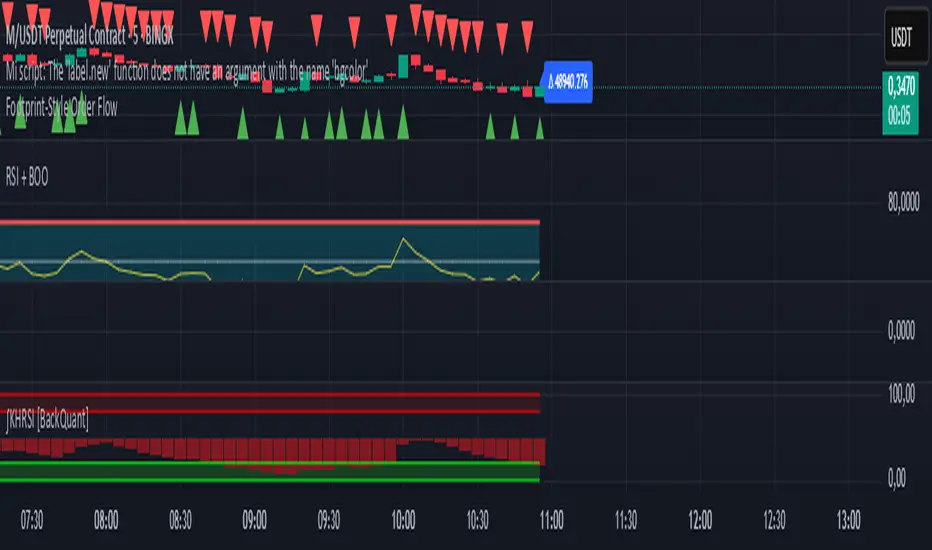
Footprint-Style Order Flow by Kalibea📊 Indicator: "Footprint-Style Order Flow by Kalibea"
Simplified Order Flow Analysis for TradingView
This indicator was created by Kalibea to bring you the power of Order Flow analysis in a clear, practical way—without technical complexity and fully compatible with TradingView.
While TradingView doesn’t support traditional footprint charts, this tool simulates institutional market reading using a smart calculation of estimated volume delta, helping you make more informed trading decisions.
🔍 What does this indicator do?
Estimated Delta: Calculates the difference between buying and selling pressure per candle, based on price movement and volume.
Smart Visual Signals:
🔼 Green Triangle: Potential buy entry (buyer dominance).
🔽 Red Triangle: Potential sell entry (seller dominance).
Delta Histogram: Displays whether each candle was driven more by buyers or sellers.
Live Labels: Shows real-time delta values above each candle for quick interpretation.
🧠 How does it help your trading?
Detects real-time market imbalances (who's in control: buyers or sellers).
Improves entry and exit timing, especially on lower timeframes.
Helps you confirm other strategies such as supply/demand zones, support/resistance, or candlestick patterns.
Provides an institutional-style reading simplified for use within TradingView.
⚙️ Fully Customizable to Your Style
Adjust the delta sensitivity to suit any market: Forex, Crypto, Indices, and more.
Turn on/off visual signals and histogram as needed.
🔑 Recommended by Kalibea for:
✅ Intraday traders and scalpers
✅ Traders looking to take the next step into institutional-style analysis
✅ Those seeking precise entries without overcomplicating their charts
💬 “Order Flow is the market’s internal voice. This indicator helps you hear it—no expensive footprint software required.”
— Kalibea
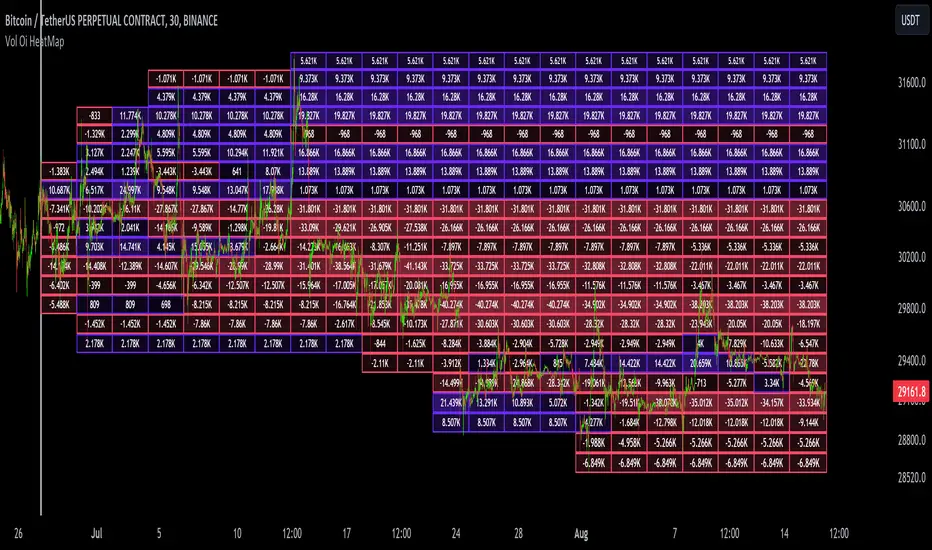
Dynamic Liquidity Map [Kioseff Trading]Hello!
Just a quick/fun project here: "Dynamic Heatmap".
This script draws a volume delta or open interest delta heatmap for the asset on your chart.
The adjective "Dynamic" is used for two reasons (:
1: Self-Adjusting Lower Timeframe Data
The script requests ~10 lower timeframe volume and open interest data sets.
When using the fixed range feature the script will, beginning at the start time, check the ~10 requested lower timeframes to see which of the lower timeframes has available data.
The script will always use the lowest timeframe available during the calculation period. As time continues, the script will continue to check if new lower timeframe data (lower than the currently used lowest timeframe) is available. This process repeats until bar time is close enough to the current time that 1-minute data can be retrieved.
The image above exemplifies the process.
Incrementally lower timeframe data will be used as it becomes available.
1: Fixed range capabilities
The script features a "fixed range" tool, where you can manually set a start time (or drag & drop a bar on the chart) to determine the interval the heatmap covers.
From the start date, the script will calculate the calculate the sub-intervals necessary to draw a rows x columns heatmap. Consequently, setting the start time further back will draw a heat map with larger rows x columns, whereas, a start time closer to the current bar time will draw a more "precise" heatmap with smaller rows x columns.
Additionally, the heatmap can be calculated using open interest data.
The image above shows the heatmap displaying open interest delta.
The image above shows alternative settings for the heatmap.
Delta values have been hidden alongside grid border colors. These settings can be replicated to achieve a more "traditional" feel for the heatmap.
Thanks for checking this out!
Liquidation Ranges + Volume/OI Dots [Kioseff Trading]Hello!
Introducing a multi-faceted indicator "Liquidation Ranges + Volume Dots" - this indicator replicates the volume dot tools found on various charting platforms and populates a liquidation range on crypto assets!
Features
Volume/OI dots populated according to user settings
Size of volume/OI dots corresponds to degree of abnormality
Naked level volume dots
Fixed range capabilities for volume/OI dots
Visible time range capabilities for volume/OI dots
Lower timeframe data used to discover iceberg orders (estimated using 1-minute data)
S/R lines drawn at high volume/OI areas
Liquidation ranges for crypto assets (10x - 100x)
Liquidation ranges are calculated using a popular crypto exchange's method
# of violations of liquidation ranges are recorded and presented in table
Pertinent high volume/OI price areas are recorded and presented in table
Personalized coloring for volume/OI dots
Net shorts / net long for the price range recorded
Lines shows reflecting net short & net long increases/decreases
Configurable volume/OI heatmap (displayed between liquidation ranges)
And some more (:
Liquidation Range
The liquidation range component of the indicator uses a popular crypto exchange's calculation (for liquidation ranges) to populate the chart for where 10x - 100x leverage orders are stopped out.
The image above depicts features corresponding to net shorts and net longs.
The image above shows features corresponding to liquidation zones for the underlying coin.
The image above shows the option to display volume/oi delta at the time the corresponding grid was traded at.
The image above shows an instance of using the "fixed range" feature for the script.
*The average price of the range is calculated to project liquidation zones.
*Heatmap is calculated using OI (or volume) delta.
Huge thank you to Pine Wizard @DonovanWall for his range filter code!
Price ranges are automatically detected using his calculation (:
Volume / OI Dots
Similar to other charting platforms, the volume/OI dots component of the indicator distinguishes "abnormal" changes in volume/OI; the detected price area is subsequently identified on the chart.
The detection method uses percent rank and calculates on the last bar of the chart. The "agelessness" of detection is contingent on user settings.
The image above shows volume dots in action; the size of each volume dot corresponds to the amount of volume at the price area.
Smaller dots = lower volume
Larger dots = higher volume
The image above exemplifies the highest aggression setting for volume/OI dot detection.
The table oriented top-right shows the highest volume areas (discovered on the 1-minute chart) for the calculated period.
The open interest change and corresponding price level are also shown. Results are listed in descending order but can also be listed in order of occurrence (most relevant).
Additionally, you can use the visible time range feature to detect volume dots.
The feature shows and explains how the visible range feature works. You select how many levels you want to detect and the script will detect the selected number of levels.
For instance, if I select to show 20 levels, the script will find the 20 highest volume/OI change price areas and distinguish them.
The image above shows a narrower price range.
The image above shows the same price range; however, the script is detecting the highest OI change price areas instead of volume.
* You can also set a fixed range with this feature
* Naked levels can be used
Additionally, you can select for the script to show only the highest volume/ OI change price area for each bar. When active, the script will successively identify the highest volume / OI change price area for the most recent bars.
Naked Levels
The image above shows and explains how naked levels can be detected when using the script.
And that's pretty much it!
Of course, there're a few more features you can check out when you use the script that haven't been explained here (:
Thank you again to @DonovanWall
Thank you to @Trendoscope for his binary insertion sort library (:
Thank you to @PineCoders for their time library
Thank you for checking this out!

10x Bull Vs. Bear VP Intraday Sessions [Kioseff Trading]Hello!
This script "10x Bull Vs. Bear VP Intraday Sessions" lets the user configure up to 10 session ranges for Bull Vs. Bear volume profiles!
Features
Up To 10 Fixed Ranges!
Volume Profile Anchored to Fixed Range
Delta Ladder Anchored to Range
Bull vs Bear Profiles!
Standard Poc and Value Area Lines, in Addition to Separated POCs and Value Area Lines for Bull Profiles and Bear Profiles
Configurable Value Area Target
Up to 2000 Profile Rows per Visible Range
Stylistic Options for Profiles
This script generates Bull vs. Bear volume profiles for up to 10 fixed ranges!
Up to 2000 volume profile levels (price levels) Can be calculated for each profile, thanks to the new polyline feature, allowing for less aggregation / more precision of volume at price and volume delta.
Bull vs Bear Profiles
The image above shows primary functionality!
Green profiles = buying volume
Red profiles = selling volume
All colors are configurable.
Bullish & bearish POC + value areas for each fixed range are displayable!
That’s about it :D
This indicator is part of a series titled “Bull vs. Bear”.
If you have any suggestions please feel free to share!

Ectopic Bar by Moti RakamEctopic Bar is an indicator that highlights a pin-bar candle that has divergence in it's shape and volume delta. To find volume delta, code of standard Up/Down volume indicator has been used.
PIN BAR : pin bar are marked by using Close Range option parameter. Default value is set to 0.35 which implies any candle that closes in the 35% of its high/low will be considered a pin bar (of course the code also ensures that rest of the bar body is only a wick).
HOW IT WORKS:
Up/Down volume variables "Up Volume" and "Down Volume" are checked against the shape of the pin bar to find an ectopic situation. For example, if a bullish pin bar candle (a bullish hammer) has more sell volume than buy volume, that's an ectopic situation. The bullish hammer shows a buying push from the bottom of the wick, instead the up/down volume indicator shows there were more sell orders than buy orders. Hence the ectopic situation. Similarly, an inverted hammer (a bearish hammer) in general should have more sell volume, but instead if it has more buying volume, the indicator highlights it as an ectopic bar.
Ectopic Bars are painted in yellow colour.

Z-Score Multi-Model ClusteringA price/volume clustering framework combining three market behavior models into a single indicator. Designed to help identify emerging trend strength, turning points, and volatility-driven entries or exits.
🔍 How It Works
This indicator classifies market states by comparing normalized price/volume behavior (via Z-Score) to different types of statistical or geometric "cluster centers." You can choose from three clustering approaches:
🧠 Clustering Models
1. Percentile (Z+CVD) – Trend Momentum Bias
Uses volume Z-Score + Cumulative Volume Delta (CVD).
Detects institutional pressure by clustering volume surges with directional delta.
Best for: Breakouts, momentum trades, volume-led reversals.
Cluster Colors:
🔹 Green triangle = Strong bullish confluence
🔻 Red triangle = Bearish divergence (bull trap risk)
⚪ Gray = Neutral/low conviction
2. Euclidean (Z+Slope) – Swing Mean-Reversion
Measures the angle of recent Z-score slope and compares it to directional cluster centers.
Helps detect early directional shifts or exhaustion.
Best for: Swing entries, pullback setups, exit timing
3. Hilbert Phase – Turn Detection via Signal Phase
Applies Hilbert Transform to the Z-Score, measuring the phase difference between trend and oscillator components.
Ideal for anticipating turns or detecting cyclical inflection points.
Useful for: Scalping, top/bottom spotting, volatility fades
✅ Features
Auto-updating cluster logic based on current data
Tooltips and clean user interface
Optional cluster bar coloring (can be toggled off)
Signal-only plotting keeps candlesticks readable
Clear entry/exit logic with triangle markers
Supports trend, swing, and oscillation-based systems
🛠️ Suggested Use Cases
Combine with VWAP, Session High/Low, or Liquidity Zones to confirm entry conditions.
Use Cluster 2 (strong bullish) on pullbacks to trend structure for add-on entries.
Use Cluster 1 in strong trends to watch for potential traps or exits.
Toggle models based on your strategy: e.g., Hilbert for scalping, Percentile for macro trend breaks.
🧪 Best Timeframes
Works across all markets and timeframes
For Percentile (Z+CVD), use intraday TF with 1m–5m CVD source
Hilbert and Euclidean preferred on 5m–1h for accurate slope/phase signals
⚠️ Notes
Clusters do not generate trade signals alone; use them in context with structure, VWAP, or trend filters.
Marker signals are filtered with a magnitude threshold to reduce noise.

Footprint BoxesThe Footprint Boxes indicator takes each higher-timeframe candle and builds a mini “footprint” map of where buying and selling happened within that bar’s range. You choose how many price bins to split the candle into and which lower timeframe to sample. For each small interval it grabs the signed volume (positive when the close is above the open, negative when below) and distributes that volume evenly across every bin touched by the price move in that interval.
Once the bar closes , the script finds the true high and low of all the lower-timeframe candles that make up the parent bar, divides that span into your chosen number of bins, and sums up the signed volume in each bin. It then draws a row of colored boxes beside the bar: green-tinted boxes for net buying and red-tinted ones for net selling, with shade intensity proportional to the percentage of total volume in that bin . Each box is labeled with its percentage of the bar’s total volume delta.
Finally, it draws one extra box with a bold white border showing the bar’s overall delta (net buying minus selling) as an absolute number. This gives you both a granular view of intra-bar activity and a quick glance at whether the buyers or sellers dominated the entire candle.

CVD [able0.1]# CVD Overlay iOS Style - Complete User Guide
## 📖 Table of Contents
1. (#what-is-cvd)
2. (#installation-guide)
3. (#understanding-the-display)
4. (#reading-the-info-table)
5. (#settings--customization)
6. (#trading-strategies)
7. (#common-mistakes-to-avoid)
---
## 🎯 What is CVD?
**CVD (Cumulative Volume Delta)** tracks the **difference between buying and selling pressure** over time.
### Simple Explanation:
- **Positive CVD** (Orange) = More buying than selling = Bulls winning
- **Negative CVD** (Gray) = More selling than buying = Bears winning
- **Rising CVD** = Increasing buying pressure = Potential uptrend
- **Falling CVD** = Increasing selling pressure = Potential downtrend
### Why It Matters:
CVD helps you see **who's really in control** of the market - not just price movement, but actual buying/selling volume.
---
## 🚀 Installation Guide
### Step 1: Open Pine Editor
1. Go to TradingView
2. Click the **"Pine Editor"** tab at the bottom of the screen
3. Click **"New"** or open an existing script
### Step 2: Copy & Paste the Code
1. Select all existing code (Ctrl+A / Cmd+A)
2. Delete it
3. Copy the entire CVD iOS Style code
4. Paste it into Pine Editor
### Step 3: Add to Chart
1. Click **"Save"** button (or Ctrl+S / Cmd+S)
2. Click **"Add to Chart"** button
3. The indicator will appear on your chart!
### Step 4: Initial Setup
- The indicator appears as an **overlay** on your price chart
- You'll see an **orange/gray line** following price
- An **info table** appears in the top-right corner
---
## 📊 Understanding the Display
### Main Chart Elements:
#### 1. **CVD Line** (Orange/Gray)
- **Orange Line** = Positive CVD (buying pressure)
- **Gray Line** = Negative CVD (selling pressure)
- This line moves with your price chart but shows volume delta
#### 2. **CVD Zone** (Shaded Area)
- Light shaded box around the CVD line
- Shows the "range" of CVD movement
- Helps visualize CVD boundaries
#### 3. **Center Line** (Dotted)
- Gray dotted line in the middle of the zone
- Represents the "neutral" point
- CVD crossing this = shift in market control
#### 4. **Reference Asset Line** (Light Gray)
- Shows Bitcoin (BTC) price movement for comparison
- Helps you see if your asset moves with or against BTC
- Can be changed to any asset you want
#### 5. **CVD Label**
- Shows current CVD value
- Positioned above/below zone to avoid overlap
- Updates in real-time
#### 6. **Reset Background** (Very Light Gray)
- Appears when CVD resets
- Indicates a new calculation period
---
## 📋 Reading the Info Table
The info table (top-right) shows **8 key metrics**:
### Row 1: **Header**
```
╔═ CVD able ═╗ | 15m | ████████ | able
```
- **CVD able** = Indicator name + creator
- **15m** = Current timeframe
- **████████** = Visual decoration
- **able** = Creator signature
### Row 2: **CVD Value**
```
CVD▲ | 7.39K | ████████ | █
█
█
```
- **CVD▲** = CVD with trend arrow
- ▲ = CVD increasing
- ▼ = CVD decreasing
- ► = CVD unchanged
- **7.39K** = Actual CVD number
- **Progress Bar** = Visual strength (darker = stronger)
- **Vertical Bars** = Height shows intensity
### Row 3: **Delta**
```
◆DELTA | -1.274K | ████░░░░ | ░
░
```
- **Delta** = Volume change THIS BAR ONLY
- **Negative** = More selling this bar
- **Positive** = More buying this bar
- Shows **immediate** pressure (not cumulative)
### Row 4: **UP Volume**
```
UP↑ | -1.263K | ████████ | █
█
█
```
- Total **buying volume** this bar
- Higher = Stronger buying pressure
- Green/Orange vertical bars = Bullish strength
### Row 5: **DOWN Volume**
```
DN↓ | 2.643K | ████████ | ░
░
░
```
- Total **selling volume** this bar
- Higher = Stronger selling pressure
- Gray vertical bars = Bearish strength
### Row 6-7: **Reference Asset** (if enabled)
```
══ REF ══ | ══════ | ████████ | █
█
PRICE▲ | 4130.300 | ████████ | █
█
```
- **REF** = Reference asset header
- **PRICE▲** = Reference price with trend
- Shows if BTC (or chosen asset) is rising/falling
- Compare with your chart to see correlation
### Row 8: **Market Status**
```
◄STATUS► | NEUT | ████░░░░ | ▒
▒
```
- **BULL** = CVD positive + Delta positive = Strong buying
- **BEAR** = CVD negative + Delta negative = Strong selling
- **NEUT** = Mixed signals = Wait for clarity
**Status Colors:**
- **Orange background** = Bullish (good for long)
- **Gray background** = Bearish (good for short)
- **White background** = Neutral (no clear signal)
---
## ⚙️ Settings & Customization
### Main Settings (⚙️)
#### **CVD Reset**
- **None** = CVD never resets (from beginning of data)
- **On Higher Timeframe** = Resets when HTF candle closes
- 15m chart → Resets hourly
- 1h chart → Resets daily
- Recommended for most traders
- **On Session Start** = Resets at market open
- **On Visible Chart** = Resets from leftmost visible bar
#### **Precision**
- **Low (Fast)** = Uses 1m data, faster but less accurate
- **Medium** = Uses 5m data, balanced (recommended)
- **High** = Uses 15m data, most accurate but slower
#### **Cumulative**
- ✅ On = CVD accumulates over time (recommended)
- ❌ Off = Shows only current bar delta
#### **Show Labels**
- ✅ On = Shows CVD value label on chart
- ❌ Off = Cleaner chart, no label
#### **Show Info Table**
- ✅ On = Shows info table (recommended for beginners)
- ❌ Off = Hide table for minimalist view
---
### 🎨 iOS Style Colors
You can customize **every color** to match your chart theme:
#### **Primary Colors**
- **Primary (Orange)** = Main bullish color (#FF9500)
- **Secondary (Gray)** = Main bearish color (#8E8E93)
- **Background** = Table background (#FFFFFF)
- **Text** = Text color (#1C1C1E)
#### **Bullish/Bearish**
- **Bullish (Orange)** = Positive CVD color
- **Bearish (Gray)** = Negative CVD color
- **Opacity** = Zone transparency (0-100%)
- **Show Zone** = Enable/disable shaded area
#### **Table Colors** (📋)
- **Header Background** = Top row background
- **Header Text** = Top row text color
- **Cell Background** = Data cells background
- **Cell Text** = Data cells text color
- **Border** = Table border color
- **Accent Background** = Special rows background
- **Alert Background** = Warning/status background
---
### 📊 Reference Asset Settings
#### **Enable**
- ✅ On = Shows reference asset line
- ❌ Off = Hide reference asset
#### **Symbol**
- Default: `BINANCE:BTCUSDT`
- Can change to any asset:
- `BINANCE:ETHUSDT` (Ethereum)
- `SPX` (S&P 500)
- `DXY` (US Dollar Index)
- Any ticker symbol
#### **Color & Width**
- Customize line appearance
- Width: 1-4 (thickness)
---
## 💡 Trading Strategies
### Strategy 1: CVD Divergence (Beginner-Friendly)
**What to Look For:**
- Price making **higher highs** but CVD making **lower highs** = Bearish divergence
- Price making **lower lows** but CVD making **higher lows** = Bullish divergence
**How to Trade:**
1. Wait for divergence to form
2. Look for confirmation (price reversal, candlestick pattern)
3. Enter trade in divergence direction
4. Stop loss beyond recent high/low
**Example:**
```
Price: /\ /\ /\ (higher highs)
CVD: /\ / \/ (lower highs) = Bearish signal
```
### Strategy 2: CVD Trend Following (Intermediate)
**What to Look For:**
- **Strongly rising CVD** + **rising price** = Strong uptrend
- **Strongly falling CVD** + **falling price** = Strong downtrend
**How to Trade:**
1. Wait for CVD and price moving in same direction
2. Enter on pullbacks to support/resistance
3. Stay in trade while CVD trend continues
4. Exit when CVD trend breaks
**Signals:**
- CVD ▲▲▲ + Price ↑ = Go LONG
- CVD ▼▼▼ + Price ↓ = Go SHORT
### Strategy 3: CVD + Reference Asset (Advanced)
**What to Look For:**
- Your asset **rising** but BTC (reference) **falling** = Relative strength
- Your asset **falling** but BTC (reference) **rising** = Relative weakness
**How to Trade:**
1. Compare CVD movement with BTC
2. If your CVD rises faster than BTC = Buy signal
3. If your CVD falls faster than BTC = Sell signal
4. Use for **pair trading** or **asset selection**
### Strategy 4: Volume Delta Confirmation
**What to Look For:**
- **Large positive Delta** = Strong buying this bar
- **Large negative Delta** = Strong selling this bar
**How to Trade:**
1. Price breaks resistance + Large positive Delta = Confirmed breakout
2. Price breaks support + Large negative Delta = Confirmed breakdown
3. Use Delta to **confirm** price moves, not predict them
**Rules:**
- Delta > 2x average = Very strong pressure
- Delta near zero at key level = Weak move, likely false breakout
---
## 🎓 Reading Real Scenarios
### Scenario 1: Strong Buying Pressure
```
Table Shows:
CVD▲ | 12.5K | ████████ | ████ (CVD rising)
◆DELTA | +2.8K | ████████ | ▲ (Positive delta)
UP↑ | 3.1K | ████████ | ████ (High buy volume)
DN↓ | 0.3K | ██░░░░░░ | ░ (Low sell volume)
◄STATUS► | BULL | ████████ | ████ (Orange background)
```
**Interpretation:** Strong buying, good for LONG trades
### Scenario 2: Distribution (Hidden Selling)
```
Table Shows:
CVD► | 8.2K | ████░░░░ | ▒▒ (CVD flat)
◆DELTA | -1.5K | ████████ | ▼ (Negative delta)
UP↑ | 0.8K | ███░░░░░ | ░ (Low buy volume)
DN↓ | 2.3K | ████████ | ████ (High sell volume)
◄STATUS► | BEAR | ████████ | ░░░░ (Gray background)
```
**Interpretation:** Price may look stable, but selling increasing = Prepare for drop
### Scenario 3: Neutral/Choppy Market
```
Table Shows:
CVD► | 5.1K | ████░░░░ | ▒ (CVD sideways)
◆DELTA | +0.2K | ██░░░░░░ | ─ (Small delta)
UP↑ | 1.2K | ████░░░░ | ▒ (Medium buy)
DN↓ | 1.0K | ████░░░░ | ▒ (Medium sell)
◄STATUS► | NEUT | ████░░░░ | ▒▒ (White background)
```
**Interpretation:** No clear direction = Stay out or reduce position size
---
## ⚠️ Common Mistakes to Avoid
### Mistake 1: Trading on CVD Alone
- ❌ **Wrong:** "CVD is rising, I'll buy immediately"
- ✅ **Right:** "CVD is rising, let me check price structure, support/resistance, and wait for confirmation"
### Mistake 2: Ignoring Delta
- ❌ **Wrong:** Looking only at cumulative CVD
- ✅ **Right:** Watch both CVD (trend) and Delta (momentum)
- Delta shows **immediate** pressure changes
### Mistake 3: Wrong Timeframe
- ❌ **Wrong:** Using 1m chart with High Precision (too slow)
- ✅ **Right:** Match precision to timeframe:
- 1m-5m → Low Precision
- 15m-1h → Medium Precision
- 4h+ → High Precision
### Mistake 4: Not Using Reset
- ❌ **Wrong:** Using "None" reset for intraday trading
- ✅ **Right:** Use "On Higher Timeframe" to see fresh CVD each session
### Mistake 5: Overtrading Neutral Status
- ❌ **Wrong:** Forcing trades when STATUS = NEUT
- ✅ **Right:** Only trade clear BULL or BEAR status
### Mistake 6: Ignoring Reference Asset
- ❌ **Wrong:** Trading altcoin without checking BTC
- ✅ **Right:** Always check if BTC CVD agrees with your asset
---
## 🔥 Pro Tips
### Tip 1: Multi-Timeframe Analysis
- Check CVD on **3 timeframes**:
- Lower TF (15m) = Entry timing
- Current TF (1h) = Trade direction
- Higher TF (4h) = Overall trend
### Tip 2: Volume Confirmation
- Big price move + Small Delta = **Weak move** (likely reversal)
- Small price move + Big Delta = **Strong accumulation** (continuation)
### Tip 3: CVD Reset Zones
- Pay attention to **reset backgrounds** (light gray)
- Often marks **session starts** = High volatility periods
### Tip 4: Divergence + Status
- Bearish divergence + STATUS = BEAR = **Strongest short signal**
- Bullish divergence + STATUS = BULL = **Strongest long signal**
### Tip 5: Color Psychology
- **Orange** (Bullish) is **warm** = Buying energy
- **Gray** (Bearish) is **cool** = Selling pressure
- Train your eye to read colors instantly
### Tip 6: Table as Quick Scan
- Glance at table without reading numbers:
- **All orange** = Bullish
- **All gray** = Bearish
- **Mixed** = Wait
---
## 📱 Quick Reference Card
| Signal | CVD | Delta | Status | Action |
|--------|-----|-------|--------|--------|
| **Strong Buy** | ▲▲ High | ++ Positive | BULL | Long Entry |
| **Strong Sell** | ▼▼ Low | -- Negative | BEAR | Short Entry |
| **Divergence Buy** | ▲ Rising | Price ▼ | → BULL | Long Setup |
| **Divergence Sell** | ▼ Falling | Price ▲ | → BEAR | Short Setup |
| **Neutral** | → Flat | ~0 Near Zero | NEUT | Stay Out |
| **Accumulation** | → Flat | ++ Positive | NEUT→BULL | Watch for Breakout |
| **Distribution** | → Flat | -- Negative | NEUT→BEAR | Watch for Breakdown |
---
## 🆘 Troubleshooting
### Issue: "Indicator not showing"
- **Solution:** Make sure overlay=true in code, re-add to chart
### Issue: "Table overlaps with price"
- **Solution:** Change table position in code or use TradingView's "Move" feature
### Issue: "CVD line too far from price"
- **Solution:** This is normal! CVD is volume-based, not price-based. Focus on CVD direction, not position
### Issue: "Too many lines on chart"
- **Solution:** Disable "Show Zone" and "Show Labels" in settings for cleaner view
### Issue: "Calculations too slow"
- **Solution:** Change Precision to "Low (Fast)" or use higher timeframe
### Issue: "Reference asset not showing"
- **Solution:** Check if "Enable" is ON and symbol is valid (e.g., BINANCE:BTCUSDT)
---
## 🎬 Getting Started Checklist
- Install indicator on TradingView
- Set precision to "Medium"
- Set reset to "On Higher Timeframe"
- Enable info table
- Add reference asset (BTC)
- Practice reading the table on demo account
- Test on different timeframes (15m, 1h, 4h)
- Compare CVD with your current strategy
- Paper trade for 1 week before going live
- Keep a trading journal of CVD signals
---
## 📚 Summary
**CVD shows WHO is winning: Buyers or Sellers**
**Key Points:**
1. **Orange/Rising CVD** = Buying pressure = Bullish
2. **Gray/Falling CVD** = Selling pressure = Bearish
3. **Delta** = Immediate momentum THIS BAR
4. **Status** = Overall market condition
5. **Always confirm** with price action & other indicators
**Remember:**
- CVD is a **tool**, not a crystal ball
- Use with proper risk management
- Practice makes perfect
- Stay disciplined!
---
**Created by: able**
**Version:** iOS Style v1.0
**Contact:** For questions, refer to TradingView community
Happy Trading! 🚀📈

Quantile-Based Adaptive Detection🙏🏻 Dedicated to John Tukey. He invented the boxplot, and I finalized it.
QBAD (Quantile-Based Adaptive Detection) is ‘the’ adaptive (also optionally weighted = ready for timeseries) boxplot with more senseful fences. Instead of hardcoded multipliers for outer fences, I base em on a set of quantile-based asymmetry metrics (you can view it as an ‘algorithmic’ counter part of central & standardized moments). So outer bands are Not hardcoded, not optimized, not cross-validated etc, simply calculated at O(nlogn).
You can use it literally everywhere in any context with any continuous data, in any task that requires statistical control, novelty || outlier detection, without worrying and doubting the sense in arbitrary chosen thresholds. Obviously, given the robust nature of quantiles, it would fit best the cases where data has problems.
The thresholds are:
Basis: the model of the data (median in our case);
Deviations: represent typical spread around basis, together form “value” in general sense;
Extensions: estimate data’s extremums via combination of quantile-based asymmetry metrics without relying on actual blunt min and max, together form “range” / ”frame”. Datapoints outside the frame/range are novelties or outliers;
Limits: based also on quantile asymmetry metrics, estimate the bounds within which values can ‘ever’ emerge given the current data generating process stays the same, together form “field”. Datapoints outside the field are very rare, happen when a significant change/structural break happens in current data-generating process, or when a corrupt datapoint emerges.
…
The first part of the post is for locals xd, the second is for the wanderers/wizards/creators/:
First part:
In terms of markets, mostly u gotta worry about dem instruments that represent crypto & FX assets: it’s either activity hence data sources there are decentralized, or data is fishy.
For a higher algocomplexity cost O(nlong), unlike MBAD that is 0(n), this thing (a control system in fact) works better with ishy data (contaminated with wrong values, incomplete, missing values etc). Read about the “ breakdown point of an estimator ” if you wanna understand it.
Even with good data, in cases when you have multiple instruments that represent the same asset, e.g. CL and BRN futures, and for some reason you wanna skip constructing a proper index of em (while you should), QBAD should be better put on each instrument individually.
Another reason to use this algo-based rather than math-based tool, might be in cases when data quality is all good, but the actual causal processes that generate the data are a bit inconsistent and/or possess ‘increased’ activity in a way. SO in high volatility periods, this tool should provide better.
In terms of built-ins you got 2 weightings: by sequence and by inferred volume delta. The former should be ‘On’ all the time when you work with timeseries, unless for a reason you want to consciously turn it off for a reason. The latter, you gotta keep it ‘On’ unless you apply the tool on another dataset that ain’t got that particular additional dimension.
Ain’t matter the way you gonna use it, moving windows, cumulative windows with or without anchors, that’s your freedom of will, but some stuff stays the same:
Basis and deviations are “value” levels. From process control perspective, if you pls, it makes sense to Not only fade or push based on these levels, but to also do nothing when things are ambiguous and/or don’t require your intervention
Extensions and limits are extreme levels. Here you either push or fade, doing nothing is not an option, these are decisive points in all the meanings
Another important thing, lately I started to see one kind of trend here on tradingview as well and in general in near quant sources, of applying averages, percentiles etc ‘on’ other stationary metrics, so called “indicators”. And I mean not for diagnostic or development reasons, for decision making xd
This is not the evil crime ofc, but hillbilly af, cuz the metrics are stationary it means that you can model em, fit a distribution, like do smth sharper. Worst case you have Bayesian statistics armed with high density intervals and equal tail intervals, and even some others. All this stuff is not hard to do, if u aint’t doing it, it’s on you.
So what I’m saying is it makes sense to apply QBAD on returns ‘of your strategy’, on volume delta, but Not on other metrics that already do calculations over their own moving windows.
...
Second part:
Looks like some finna start to have lil suspicions, that ‘maybe’ after all math entities in reality are more like blueprints, while actual representations are physical/mechanical/algorithmic. Std & centralized moments is a math entity that represents location, scale & asymmetry info, and we can use it no problem, when things are legit and consistent especially. Real world stuff tho sometimes deviates from that ideal, so we need smth more handy and real. Add to the mix the algo counter part of means: quantiles.
Unlike the legacy quantile-based asymmetry metrics from the previous century (check quantile skewness & kurtosis), I don’t use arbitrary sets of quantiles, instead we get a binary pattern that is totally geometric & natural (check the code if interested, I made it very damn explicit). In spirit with math based central & standardized moments, each consequent pair is wider empathizing tail info more and more for each higher order metric.
Unlike the classic box plot, where inner thresholds are quartiles and the rest are based on em, here the basis is median (minimises L1), I base inner thresholds on it, and we continue the pattern by basing the further set of levels on the previous set. So unlike the classic box plot, here we have coherency in construction, symmetry.
Another thing to pay attention to, tho for some reason ain’t many talk about it, it’s not conceptually right to think that “you got data and you apply std moments on it”. No, you apply it to ‘centered around smth’ data. That ‘smth’ should minimize L2 error in case of math, L1 error in case of algo, and L0 error in case of learning/MLish/optimizational/whatever-you-cal-it stuff. So in the case of L0, that’s actually the ‘mode’ of KDE, but that’s for another time. Anyways, in case of L2 it’s mean, so we center data around mean, and apply std moments on residuals. That’s the precise way of framing it. If you understand this, suddenly very interesting details like 0th and 1st central moments start to make sense. In case of quantiles, we center data around the median, and do further processing on residuals, same.
Oth moment (I call it init) is always 1, tho it’s interesting to extrapolate backwards the sequence for higher order moments construction, to understand how we actually end up with this zero.
1st moment (I call it bias) of residuals would be zero if you match centering and residuals analysis methods. But for some reason you didn’t do that (e.g centered data around midhinge or mean and applied QBAD on the centered data), you have to account for that bias.
Realizing stuff > understanding stuff
Learning 2981234 human invented fields < realizing the same unified principles how the Universe works
∞

Bar Statistics - DELTA/OI/TOTAL/BUY/SELL/LONGS/SHORTSBar Statistics - Advanced Volume & Open Interest Analysis
Overview
The Bar Statistics indicator is a comprehensive analytical tool designed to provide traders with detailed insights into market microstructure through advanced volume analysis, open interest tracking, and market flow detection. This indicator transforms complex market data into easily digestible visual information, displaying six key metrics in customizable colored boxes that update in real-time.
Unlike traditional volume indicators that only show basic volume data, this indicator combines multiple data sources to reveal the underlying forces driving price movement, including volume delta calculations from lower timeframes, open interest changes, and estimated market positioning.
What Makes This Indicator Unique
1. Multi-Timeframe Volume Delta Precision
The indicator utilizes lower timeframe data (default 1-second) to calculate highly accurate volume delta measurements, providing much more precise buy/sell pressure analysis than standard timeframe-based calculations. This approach captures intraday volume dynamics that are often missed by conventional indicators.
2. Real-Time Updates
Unlike many indicators that only update on bar completion, this tool provides live updates for the developing candle, allowing traders to see evolving market conditions as they happen.
3. Market Flow Analysis
The unique "L/S" (Long/Short) metric combines open interest changes with price/volume direction to estimate net market positioning, helping identify when participants are accumulating or distributing positions.
4. Adaptive Visual Intensity
The gradient color system automatically adjusts based on historical context, making it easy to identify when current values are significant relative to recent market activity.
5. Complete Customization
Every aspect of the display can be customized, from the order of metrics to individual color schemes, allowing traders to adapt the tool to their specific analysis needs.
6.All In One Solution
6 Metrics in one indicator no more using 5 different indicators.
Core Features Explained
DELTA (Volume Delta)
What it shows: Net difference between aggressive buy volume and aggressive sell volume
Calculation: Uses lower timeframe data to determine whether each trade was initiated by buyers or sellers
Interpretation:
Positive values indicate aggressive buying pressure
Negative values indicate aggressive selling pressure
Magnitude indicates the strength of directional pressure
OI Δ (Open Interest Change)
What it shows: Change in open interest from the previous bar
Data source: Fetches open interest data using the "_OI" symbol suffix
Interpretation:
Positive values indicate new positions entering the market
Negative values indicate positions being closed
Combined with price direction, reveals market participant behavior
L/S (Net Long/Short Bias)
What it shows: Estimated net change in long vs short market positions
Calculation method: Combines open interest changes with price/volume direction using configurable logic
Scenarios analyzed:
New Longs: Rising OI + Rising Price/Volume = Long position accumulation
Liquidated Longs: Falling OI + Falling Price/Volume = Long position exits
New Shorts: Rising OI + Falling Price/Volume = Short position accumulation
Covered Shorts: Falling OI + Rising Price/Volume = Short position exits
Result: Net bias toward long (positive) or short (negative) market sentiment
TOTAL (Total Volume)
What it shows: Standard volume for the current bar
Purpose: Provides context for other metrics and baseline activity measurement
Enhanced display: Uses gradient intensity based on recent volume history
BUY (Estimated Buy Volume)
What it shows: Estimated aggressive buy volume
Calculation: (Total Volume + Delta) / 2
Use case: Helps quantify the actual buying pressure in monetary/contract terms
SELL (Estimated Sell Volume)
What it shows: Estimated aggressive sell volume
Calculation: (Total Volume - Delta) / 2
Use case: Helps quantify the actual selling pressure in monetary/contract terms
Configuration Options
Timeframe Settings
Custom Timeframe Toggle: Enable/disable custom lower timeframe selection
Timeframe Selection: Choose the precision level for volume delta calculations
Auto-Selection Logic: Automatically selects optimal timeframe based on chart timeframe
Net Positions Calculation
Direction Method: Choose between Price-based or Volume Delta-based direction determination
Value Method: Select between Open Interest Change or Volume for position size calculations
Display Customization
Row Order: Completely customize which metrics appear and in what order (6 positions available)
Color Schemes: Individual color selection for positive/negative values of each metric
Gradient Intensity: Configurable lookback period (10-200 bars) for relative intensity calculations
Visual Elements
Box Format: Clean, professional box display with clear labels
Color Coding: Intuitive color schemes with customizable transparency gradients
Real-time Updates: Live updating for developing candles with historical stability
How to Use This Indicator
For Day Traders
Volume Confirmation: Use DELTA to confirm breakout validity - strong directional moves should show corresponding volume delta
Entry Timing: Watch for volume delta divergences at key levels to time entries
Exit Signals: Monitor when aggressive volume shifts against your position
For Swing Traders
Market Flow: Focus on the L/S metric to identify when participants are accumulating or distributing
Open Interest Analysis: Use OI Δ to confirm whether moves are backed by new money or position adjustments
Trend Validation: Combine multiple metrics to validate trend strength and sustainability
For Scalpers
Real-time Edge: Utilize the live updates to see developing imbalances before bar completion
Quick Decision Making: Focus on DELTA and BUY/SELL for immediate market pressure assessment
Volume Profile: Use TOTAL volume context for optimal entry/exit sizing
Setup Recommendations
Futures Markets: Enable OI tracking and use Volume Delta direction method
Crypto Markets: Focus on DELTA and volume metrics; OI may not be available
Stock Markets: Use Price direction method with volume value calculations
High-Frequency Analysis: Set lower timeframe to 1S for maximum precision
Technical Implementation
Data Accuracy
Utilizes TradingView's ta.requestVolumeDelta() function for precise buy/sell classification
Implements error checking for data availability
Handles missing data gracefully with fallback calculations
Performance Optimization
Efficient array management with configurable lookback periods
Smart box creation and deletion to prevent memory issues
Optimized real-time updates without historical data corruption
Compatibility
Works on all timeframes from seconds to daily
Compatible with futures, forex, crypto, and stock markets
Automatically adjusts calculation methods based on available data
Risk Disclaimers
This indicator is designed for educational and analytical purposes. It provides statistical analysis of market data but does not guarantee trading success. Users should:
Combine with other forms of analysis
Practice proper risk management
Understand that past performance doesn't predict future results
Be aware that volume delta and open interest data quality varies by market and data provider
Conclusion
The Bar Statistics indicator represents a significant advancement in retail trader access to professional-grade market analysis tools. By combining multiple data sources into a single, customizable display, it provides the depth of analysis needed for comprehensive market microstructure understanding while maintaining the simplicity required for effective decision-making.

Delta Volume Color CoderDelta Volume Color Coder - Smart Money Footprint Visualizer
OVERVIEW
The Delta Volume Color Coder is a clean, minimalist indicator that highlights candles with exceptional delta volume, helping you instantly identify where smart money is actively trading. Unlike complex volume indicators that clutter your chart, this tool simply colors candles when institutional-level volume appears, leaving your normal price action untouched.
WHAT IS DELTA VOLUME?
Delta volume represents the difference between buying and selling pressure within each candle. Positive delta indicates more aggressive buying, while negative delta shows stronger selling. When delta reaches extreme levels, it often signals institutional activity or significant market events.
KEY FEATURES
- Clean Chart Design - Only colors candles with significant delta volume
- No Chart Compression - Overlay indicator that doesn't distort price scales
- Smart Detection - Automatically calculates dynamic thresholds based on recent activity
- Customizable Thresholds - Adjust sensitivity to match your trading style
- Multiple Calculation Methods - Classic or Range-Based delta calculations
COLOR CODING (Default)
- White Candles - Extreme positive delta (massive institutional buying)
- Green Candles - High positive delta (strong buying pressure)
- Red Candles - High negative delta (strong selling pressure)
- Violet Candles - Extreme negative delta (massive institutional selling)
- Normal Candles - Unchanged (standard TradingView red/green)
HOW TO USE
1. Add to any chart - Works on all timeframes and instruments
2. Look for colored candles - These mark significant volume events
3. White/Violet candles often mark reversals or breakouts
4. Multiple colored candles in sequence indicate strong trends
5. Colored candles at support/resistance levels are especially significant
SETTINGS EXPLAINED
- Lookback Period (20) - Bars used to calculate average delta
- High Delta Threshold (1.5x) - Triggers green/red coloring
- Extreme Delta Threshold (2.5x) - Triggers white/violet coloring
- Delta Calculation - Classic (open/close) or Range Based (close position)
- Color Wicks - Option to color entire candle or just the body
- All colors fully customizable
TRADING APPLICATIONS
- Reversal Detection - White/violet candles often mark exhaustion points
- Breakout Confirmation - Colored candles on breakouts show conviction
- Support/Resistance - High delta at key levels indicates significance
- Trend Strength - Frequency of colored candles shows trend momentum
- Institutional Tracking - Extreme delta reveals where big players are active
BEST PRACTICES
- Lower timeframes (1-15m) - Use for scalping and day trading entries
- Higher timeframes (1H+) - Identify major accumulation/distribution
- Combine with price action - Most effective at key technical levels
- Watch for clusters - Multiple extreme candles = major event
- Volume confirmation - Extreme delta + high volume = highest significance
TIPS FOR SUCCESS
1. White candles after downtrends often mark bottoms
2. Violet candles after uptrends often mark tops
3. Consecutive colored candles confirm trend direction
4. Lack of colored candles = low volatility, potential breakout ahead
5. Extreme delta at round numbers indicates institutional interest
WHY THIS INDICATOR?
- Simple Yet Powerful - No complex analysis needed
- Instant Visual Feedback - See institutional activity at a glance
- Clean Charts - No overlays, lines, or clutter
- Real-Time Detection - Updates with each new candle
- Universal Application - Works on stocks, forex, crypto, futures
UNIQUE ADVANTAGES
Unlike traditional volume indicators that require separate panes or compress your chart, the Delta Volume Color Coder seamlessly integrates with your existing setup. It answers one simple question: "Where is the smart money trading RIGHT NOW?"
Perfect for traders who want institutional-level insights without the complexity. Just add to your chart and let the colors guide you to where the real action is happening.
Low Liquidity Zones [PhenLabs]📊 Low Liquidity Zones
Version: PineScript™ v6
📌 Description
Low Liquidity Zones identifies and highlights periods of unusually low trading volume on your chart, marking areas where price movement occurred with minimal participation. These zones often represent potential support and resistance levels that may be more susceptible to price breakouts or reversals when revisited with higher volume.
Unlike traditional volume analysis tools that focus on high volume spikes, this indicator specializes in detecting low liquidity areas where price moved with minimal resistance. Each zone displays its volume delta, providing insight into buying vs. selling pressure during these thin liquidity periods. This combination of low volume detection and delta analysis helps traders identify potential price inefficiencies and weak structures in the market.
🚀 Points of Innovation
• Identifies low liquidity zones that most volume indicators overlook but which often become significant technical levels
• Displays volume delta within each zone, showing net buying/selling pressure during low liquidity periods
• Dynamically adjusts to different timeframes, allowing analysis across multiple time horizons
• Filters zones by maximum size percentage to focus only on precise price levels
• Maintains historical zones until they expire based on your lookback settings, creating a cumulative map of potential support/resistance areas
🔧 Core Components
• Low Volume Detection: Identifies candles where volume falls below a specified threshold relative to recent average volume, highlighting potential liquidity gaps.
• Volume Delta Analysis: Calculates and displays the net buying/selling pressure within each low liquidity zone, providing insight into the directional bias during low participation periods.
• Dynamic Timeframe Adjustment: Automatically scales analysis periods to match your selected timeframe preference, ensuring consistent identification of low liquidity zones regardless of chart settings.
• Zone Management System: Creates, tracks, and expires low liquidity zones based on your configured settings, maintaining visual clarity on the chart.
🔥 Key Features
• Low Volume Identification: Automatically detects and highlights candles where volume falls below your specified threshold compared to the moving average.
• Volume Delta Visualization: Shows the net volume delta within each zone, providing insight into whether buyers or sellers were dominant despite the low overall volume.
• Flexible Timeframe Analysis: Analyze low liquidity zones across multiple predefined timeframes or use a custom lookback period specific to your trading style.
• Zone Size Filtering: Filters out excessively large zones to focus only on precise price levels, improving signal quality.
• Automatic Zone Expiration: Older zones are automatically removed after your specified lookback period to maintain a clean, relevant chart display.
🎨 Visualization
• Volume Delta Labels: Each zone displays its volume delta with “+” or “-” prefix and K/M suffix for easy interpretation, showing the strength and direction of pressure during the low volume period.
• Persistent Historical Mapping: Zones remain visible for your specified lookback period, creating a cumulative map of potential support and resistance levels forming under low liquidity conditions.
📖 Usage Guidelines
Analysis Timeframe
Default: 1D
Range/Options: 15M, 1HR, 3HR, 4HR, 8HR, 16HR, 1D, 3D, 5D, 1W, Custom
Description: Determines the historical period to analyze for low liquidity zones. Shorter timeframes provide more recent data while longer timeframes offer a more comprehensive view of significant zones. Use Custom option with the setting below for precise control.
Custom Period (Bars)
Default: 1000
Range: 1+
Description: Number of bars to analyze when using Custom timeframe option. Higher values show more historical zones but may impact performance.
Volume Analysis
Volume Threshold Divisor
Default: 0.5
Range: 0.1-1.0
Description: Maximum volume relative to average to identify low volume zones. Example: 0.5 means volume must be below 50% of the average to qualify as low volume. Lower values create more selective zones while higher values identify more zones.
Volume MA Length
Default: 15
Range: 1+
Description: Period length for volume moving average calculation. Shorter periods make the indicator more responsive to recent volume changes, while longer periods provide a more stable baseline.
Zone Settings
Zone Fill Color
Default: #2196F3 (80% transparency)
Description: Color and transparency of the low liquidity zones. Choose colors that stand out against your chart background without obscuring price action.
Maximum Zone Size %
Default: 0.5
Range: 0.1+
Description: Maximum allowed height of a zone as percentage of price. Larger zones are filtered out. Lower values create more precise zones focusing on tight price ranges.
Display Options
Show Volume Delta
Default: true
Description: Toggles the display of volume delta within each zone. Enabling this provides additional insight into buying vs. selling pressure during low volume periods.
Delta Text Position
Default: Right
Options: Left, Center, Right
Description: Controls the horizontal alignment of the delta text within zones. Adjust based on your chart layout for optimal readability.
✅ Best Use Cases
• Identifying potential support and resistance levels that formed during periods of thin liquidity
• Spotting price inefficiencies where larger players may have moved price with minimal volume
• Finding low-volume consolidation areas that may serve as breakout or reversal zones when revisited
• Locating potential stop-hunting zones where price moved on minimal participation
• Complementing traditional support/resistance analysis with volume context
⚠️ Limitations
• Requires volume data to function; will not work on symbols where the data provider doesn’t supply volume information
• Low volume zones don’t guarantee future support/resistance - they simply highlight potential areas of interest
• Works best on liquid instruments where volume data has meaningful fluctuations
• Historical analysis is limited by the maximum allowed box count (500) in TradingView
• Volume delta in some markets may not perfectly reflect buying vs. selling pressure due to data limitations
💡 What Makes This Unique
• Focus on Low Volume: Unlike some indicators that highlight high volume events particularly like our very own TLZ indicator, this tool specifically identifies potentially significant price zones that formed with minimal participation.
• Delta + Low Volume Integration: Combines volume delta analysis with low volume detection to reveal directional bias during thin liquidity periods.
• Flexible Lookback System: The dynamic timeframe system allows analysis across any timeframe while maintaining consistent zone identification criteria.
• Support/Resistance Zone Generation: Automatically builds a visual map of potential technical levels based on volume behavior rather than just price patterns.
🔬 How It Works
1. Volume Baseline Calculation:
The indicator calculates a moving average of volume over your specified period to establish a baseline for normal market participation. This adaptive baseline accounts for natural volume fluctuations across different market conditions.
2. Low Volume Detection:
Each candle’s volume is compared to the moving average and flagged when it falls below your threshold divisor. The indicator also filters zones by maximum size to ensure only precise price levels are highlighted.
3. Volume Delta Integration:
For each identified low volume candle, the indicator retrieves the volume delta from a lower timeframe. This delta value is formatted with appropriate scaling (K/M) and displayed within the zone.
4. Zone Management:
New zones are created and tracked in a dynamic array, with each zone extending rightward until it expires. The system automatically removes expired zones based on your lookback period to maintain a clean chart.
💡 Note:
Low liquidity zones often represent areas where price moved with minimal participation, which can indicate potential market inefficiencies. These zones frequently become important support/resistance levels when revisited, especially if approached with higher volume. Consider using this indicator alongside traditional technical analysis tools for comprehensive market context. For best results, experiment with different volume threshold settings based on the specific instrument’s typical volume patterns.

Footprint IQ Pro [TradingIQ]Hello Traders!
Introducing "Footprint IQ Pro"!
Footprint IQ Pro is an all-in-one Footprint indicator with several unique features.
Features
Calculated delta at tick level
Calculated delta ratio at tick level
Calculated buy volume at tick level
Calculated sell volume at tick level
Imbalance detection
Stacked imbalance detection
Stacked imbalance alerts
Value area and POC detection
Highest +net delta levels detection
Lowest -net delta levels detection
CVD by tick levels
Customizable values area percentage
The image above thoroughly outlines what each metric in the delta boxes shows!
Metrics In Delta Boxes
"δ:", "\nδ%:", "\n⧎: ", "\n◭: ", "\n⧩: "
δ Delta (Difference between buy and sell volume)
δ% Delta Ratio (Delta as a percentage of total volume)
⧎ Total Volume At Level (Total volume at the price area)
◭ Total Buy Volume At Level (Total buy volume at the price area)
⧩ Total Sell Volume At Level (total sell volume at the price area)
Each metric comes with a corresponding symbol.
That said, until you become comfortable with the symbol, you can also turn on the descriptive labels setting!
The image above exemplifies the feature.
The image above shows Footprint IQ's full power!
Additionally, traders with an upgraded TradingView plan can make use of the "1-Second" feature Footprint IQ offers!
The image above shows each footprint generated using 1-second volume data. 1-second data is highly granular compared to 1-minute data and, consequently, each footprint is exceptionally more accurate!
Imbalance Detection
Footprint IQ pro is capable of detecting user-defined delta imbalances.
The image above further explains how Footprint IQ detects imbalances!
The imbalance percentage is customizable in the settings, and is set to 70% by default.
Therefore,
When net delta is positive, and the positive net delta constitutes >=70% of the total volume, a buying imbalance will be detected (upwards triangle).
When net delta is negative, and the negative net delta constitutes >=70% of the total volume, a buying imbalance will be detected (downwards triangle).
Stacked Imbalance Detection
In addition to imbalance detection, Footprint IQ Pro can also detect stacked imbalances!
The image above shows Footprint IQ Pro detecting stacked imbalances!
Stacked imbalances occur when consecutive imbalances at sequential price areas occur. Stacked imbalances are generally interpreted as significant price moves that are supported by volume, rather than a significant result with disproportionate effort.
The criteria for stacked imbalance detection (how many imbalances must occur at sequential price areas) is customizable in the settings.
The default value is three. Therefore, when three imbalances occur at sequential price areas, golden triangles will begin to print to show a stacked imbalance.
Additionally, traders can set alerts for when stacked imbalances occur!
Highest +Delta and Highest -Delta Levels
In addition to being a fully-fledged Footprint indicator, Footprint IQ Pro goes one step further by detecting price areas where the greater +Delta and -Delta are!
The image above shows price behavior near highest +Delta price areas detected by Footprint IQ!
These +Delta levels are considered important as there has been strong interest from buyers at these price areas when they are traded at.
It's expected that these levels can function as support points that are supported by volume.
The image above shows a similar function for resistance points!
Blue lines = High +Delta Detected Price Areas
Red lines = High -Delta Detected Price Areas
Value Area Detection
Similar to traditional volume profile, Footprint IQ Pro displays the value area per bar.
Green lines next to each footprint show the value area for the bar. The value area % is customizable in the settings.
CVD Levels
Footprint IQ Pro is capable of storing historical volume delta information to provide CVD measurements at each price area!
The image above exemplifies this feature!
When this feature is enabled, you will see the CVD of each price area, rather than the net delta!
And that's it!
Thank you so much to TradingView for offering the greatest charting platform for everyone to create on!
If you have any feature requests you'd like to see for Footprint IQ, please feel free to share them with us!
Thank you!

CVD+ - Multi Symbol Cumulative Volume DeltaEdit of TradingView's LTF CVD
TradingView's CVD is already the most accurate CVD on the platform because of the LTF data. The purpose of the edit is to provide the ability to compare volume flow between multiple exchanges, futures & spot, multiple symbols or any other potential use case. All in single layout or even a single pane.
Added features:
- Option to manually select a symbol from which to calculate the LTF CVD
- Option to normalize the selected symbol's CVD to the chart's symbol's CVD (Useful when you want to compare futures and spot on the same pane)
- Label that displays the selected symbol's name and exchange
- Changed presets to plot the CVD line as the predetermined option
All of TV's original features remain the same.
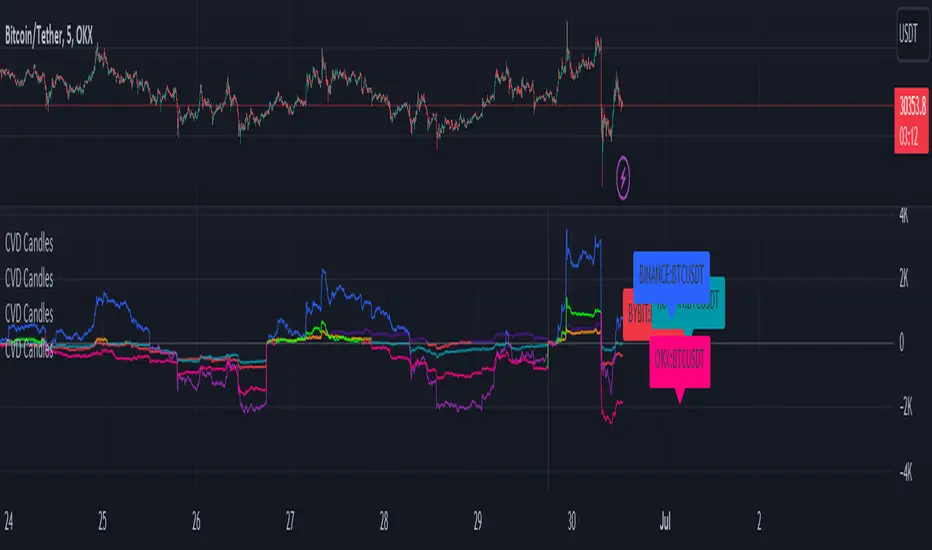
Realtime Delta Volume Action [LucF]█ OVERVIEW
This indicator displays on-chart, realtime, delta volume and delta ticks information for each bar. It aims to provide traders who trade price action on small timeframes with volume and tick information gathered as updates come in the chart's feed. It builds its own candles, which are optimized to display volume delta information. It only works in realtime.
█ WARNING
This script is intended for traders who can already profitably trade discretionary on small timeframes. The high cost in fees and the excitement of trading at small timeframes have ruined many newcomers to trading. While trading at small timeframes can work magic for adrenaline junkies in search of thrills rather than profits, I DO NOT recommend it to most traders. Only seasoned discretionary traders able to factor in the relatively high cost of such a trading practice can ever hope to take money out of markets in that type of environment, and I would venture they account for an infinitesimal percentage of traders. If you are a newcomer to trading, AVOID THIS TOOL AT ALL COSTS — unless you are interested in experimenting with the interpretation of volume delta combined with price action. No tool currently available on TradingView provides this type of close monitoring of volume delta information, but if you are not already trading small timeframes profitably, please do not let yourself become convinced that it is the missing piece you needed. Avoid becoming a sucker who only contributes by providing liquidity to markets.
The information calculated by the indicator cannot be saved on charts, nor can it be recalculated from historical bars.
If you refresh the chart or restart the script, the accumulated information will be lost.
█ FEATURES
Key values
The script displays the following key values:
• Above the bar: ticks delta (DT), the total ticks for the bar, the percentage of total ticks that DT represents (DT%)
• Below the bar: volume delta (DV), the total volume for the bar, the percentage of total volume that DV represents (DV%).
Candles
Candles are composed of four components:
1. A top shaped like this: ┴, and a bottom shaped like this: ┬ (picture a normal Japanese candle without a body outline; the values used are the same).
2. The candle bodies are filled with the bull/bear color representing the polarity of DV. The intensity of the body's color is determined by the DV% value.
When DV% is 100, the intensity of the fill is brightest. This plays well in interpreting the body colors, as the smaller, less significant DV% values will produce less vivid colors.
3. The bright-colored borders of the candle bodies occur on "strong bars", i.e., bars meeting the criteria selected in the script's inputs, which you can configure.
4. The POC line is a small horizontal line that appears to the left of the candle. It is the volume-weighted average of all price updates during the bar.
Calculations
This script monitors each realtime update of the chart's feed. It first determines if price has moved up or down since the last update. The polarity of the price change, in turn, determines the polarity of the volume and tick for that specific update. If price does not move between consecutive updates, then the last known polarity is used. Using this method, we can calculate a running volume delta and ticks delta for the bar, which becomes the bar's final delta values when the bar closes (you can inspect values of elapsed realtime bars in the Data Window or the indicator's values). Note that these values will all reset if the script re-executes because of a change in inputs or a chart refresh.
While this method of calculating is not perfect, it is by far the most precise way of calculating volume delta available on TradingView at the moment. Calculating more precise results would require scripts to have access to tick data from any chart timeframe. Charts at seconds timeframes do use exchange/broker ticks when the feeds you are using allow for it, and this indicator will run on them, but tick data is not yet available from higher timeframes. Also, note that the method used in this script is far superior to the intrabar inspection technique used on historical bars in my other "Delta Volume" indicators. This is because volume and ticks delta here are calculated from many more realtime updates than the available intrabars in history. Unfortunately, the calculation method used here cannot be used on historical bars, where intrabar inspection remains, in my opinion, the optimal method.
Inputs
The script's inputs provide many ways to personalize all the components: what is displayed, the colors used to display the information, and the marker conditions. Tooltips provide details for many of the inputs; I leave their exploration to you.
Markers
Markers provide a way for you to identify the points of interest of your choice on the chart. You control the set of conditions that trigger each of the five available markers.
You select conditions by entering, in the field for each marker, the number of each condition you want to include, separated by a comma. The conditions are:
1 — The bar's polarity is up/dn.
2 — `close` rises/falls ("rises" means it is higher than its value on the previous bar).
3 — DV's polarity is +/–.
4 — DV% rises (↕).
5 — POC rises/falls.
6 — The quantity of realtime updates rises (↕).
7 — DV > limit (You specify the limit in the inputs. Since DV can be +/–, DV– must be less than `–limit` for a short marker).
8 — DV% > limit (↕).
9 — DV+ rises for a long marker, DV– falls for a short.
10 — Consecutive DV+/DV– on two bars.
11 — Total volume rises (↕).
12 — DT's polarity is +/–.
13 — DT% rises (↕).
14 — DT+ rises for a long marker, DT– falls for a short.
Conditions showing the (↕) symbol do not have symmetrical states; they act more like filters. If you only include condition 4 in a marker's setup, for example, both long and short markers will trigger on bars where DV% rises. To trigger only long or short markers, you must add a condition providing directional differentiation, such as conditions 1 or 2. Accordingly, you would enter "1,4" or "2,4".
For a marker to trigger, ALL the conditions you specified for it must be met. Long markers appear on the chart as "Mx▲" signs under the values displayed below candles. Short markers display "Mx▼" over the number of updates displayed above candles. The marker's number will replace the "x" in "Mx▲". The script loads with five markers that will not trigger because no conditions are associated with them. To activate markers, you will need to select and enter the set of conditions you require for each one.
Alerts
You can configure alerts on this script. They will trigger whenever one of the configured markers triggers. Alerts do not repaint, so they trigger at the bar's close—which is also when the markers will appear.
█ HOW TO USE IT
As a rule, I do not prescribe expected use of my indicators, as traders have proved to be much more creative than me in using them. Additionally, I tend to think that if you expect detailed recommendations from me to be able to use my indicators, it's a sign you are in a precarious situation and should go back to the drawing board and master the necessary basics that will allow you to explore and decide for yourself if my indicators can be useful to you, and how you will use them. I will make an exception for this thing, as it presents fairly novel information. I will use simple logic to surmise potential uses, as contrary to most of my other indicators, I have NOT used this one to actually trade. Markets have a way of throwing wrenches in our seemingly bullet-proof rationalizing, so drive cautiously and please forgive me if the pointers I share here don't pan out.
The first thing to do is to disable your normal bars. You can do this by clicking on the eye icon that appears when you hover over the symbol's name in the upper-left corner of your chart.
The absolute value and polarity of DV mean little without perspective; that's why I include both total volume for the bar and the percentage that DV represents of that total volume. I interpret a low DV% value as indecision. If you share that opinion, you could, let's say, configure one of the markers on "DV% > 80%", for example (to do so you would enter "8" in the condition field of any marker, and "80" in the limit field for condition 8, below the marker conditions).
I also like to analyze price action on the bar with DV%. Small DV% values should often produce small candle bodies. If a small DV% value occurs on a bar with much movement and high volume, I'm thinking "tough battle with potential explosive power when one side wins". Conversely, large bodies with high DV% mean that large volume is breaching through multiple levels, or that nobody is suddenly willing to take the other side of a normal volume of trades.
I find the POC lines really interesting. First, they tell us the price point where the most significant action (taking into account both price occurrences AND volume) during the bar occurred. Second, they can be useful when compared against past values. Third, their color helps us in figuring out which ones are the most significant. Unsurprisingly, bunches of orange POCs tend to appear in consolidation zones, in pauses, and before reversals. It may be useful to often focus more on POC progression than on `close` values. This is not to say that OHLC values are not useful; looking, as is customary, for higher highs or lower lows, or for repeated tests of precise levels can of course still be useful. I do like how POCs add another dimension to chart readings.
What should you do with the ticks delta above bars? Old-time ticker tape readers paid attention to the sounds coming from it (the "ticker" moniker actually comes from the sound they made). They knew activity was picking up when the frequency of the "ticks" increased. My thinking is that the total number of ticks will help you in the same way, since increasing updates usually mean growing interest—and thus perhaps price movement, as increasing volatility or volume would lead us to surmise. Ticks delta can help you figure out when proportionally large, random orders come in from traders with other perspectives than the short-term price action you are typically working with when you use this tool. Just as volume delta, ticks delta are one more informational component that can help you confirm convergence when building your opinions on price action.
What are strong bars? They are an attempt to identify significance. They are like a default marker, except that instead of displaying "Mx▲/▼" below/above the bar, the candle's body is outlined in bright bull/bear color when one is detected. Strong bars require a respectable amount of conditions to be met (you can see and re-configure them in the inputs). Think of them as pushes rather than indications of an upcoming, strong and multi-bar move. Pushes do, for sure, often occur at the beginning of strong trends. You will often see a few strong bars occur at 2-3 bar intervals at the beginning or middle of trends. But they also tend to occur at tops/bottoms, which makes their interpretation problematic. Another pattern that you will see quite frequently is a final strong bar in the direction of the trend, followed a few bars later by another strong bar in the reverse direction. My summary analyses seemed to indicate these were perhaps good points where one could make a bet on an early, risky reversal entry.
The last piece of information displayed by the indicator is the color of the candle bodies. Three possible colors are used. Bull/bear is determined by the polarity of DV, but only when the bar's polarity matches that of DV. When it doesn't, the color is the divergence color (orange, by default). Whichever color is used for the body, its intensity is determined by the DV% value. Maximum intensity occurs when DV%=100, so the more significant DV% values generate more noticeable colors. Body colors can be useful when looking to confirm the convergence of other components. The visual effect this creates hopefully makes it easier to detect patterns on the chart.
One obvious methodology that comes to mind to trade with this tool would be to use another indicator like Technical Ratings at a higher timeframe to identify the larger context's trend, and then use this tool to identify entries for short-term trades in that direction.
█ NOTES AND RAMBLINGS
Instant Calculations
This indicator uses instant values calculated on the bar only. No moving averages or calculations involving historical periods are used. The only exception to this rule is in some of the marker conditions like "Two consecutive DV+ values", where information from the previous bar is used.
Trading Small vs Long Timeframes
I never trade discretionary at the 5sec–5min timeframes this indicator was designed to be used with; I trade discretionary at 1D, 1W and 1M timeframes, and let systems trade at smaller timeframes. The higher the timeframe you trade at, the fewer fees you will pay because you trade less and are not churning trading volume, as is inevitable at smaller timeframes. Trading at higher timeframes is also a good way to gain an instant edge on most of the trading crowd that has its nose to the ground and often tends to forget the big picture. It also makes for a much less demanding trading practice, where you have lots of time to research and build your long-term opinions on potential future outcomes. While the future is always uncertain, I believe trades riding on long-term trends have stronger underlying support from the reality outside markets.
To traders who will ask why I publish an indicator designed for small timeframes, let me say that my main purpose here is to showcase what can be done with Pine. I often see comments by coders who are obviously not aware of what Pine is capable of in 2021. Since its humble beginnings seven years ago, Pine has grown and become a serious programming language. TradingView's growing popularity and its ongoing commitment to keep Pine accessible to newcomers to programming is gradually making Pine more and more of a standard in indicator and strategy programming. The technical barriers to entry for traders interested in owning their trading practice by developing their personal tools to trade have never been so low. I am also publishing this script because I value volume delta information, and I present here what I think is an original way of analyzing it.
Performance
The script puts a heavy load on the Pine runtime and the charting engine. After running the script for a while, you will often notice your chart becoming less responsive, and your chart tab can take longer to activate when you go back to it after using other tabs. That is the reason I encourage you to set the number of historical values displayed on bars to the minimum that meets your needs. When your chart becomes less responsive because the script has been running on it for many hours, refreshing the browser tab will restart everything and bring the chart's speed back up. You will then lose the information displayed on elapsed bars.
Neutral Volume
This script represents a departure from the way I have previously calculated volume delta in my scripts. I used the notion of "neutral volume" when inspecting intrabar timeframes, for bars where price did not move. No longer. While this had little impact when using intrabar inspection because the minimum usable timeframe was 1min (where bars with zero movement are relatively infrequent), a more precise way was required to handle realtime updates, where multiple consecutive prices often have the same value. This will usually happen whenever orders are unable to move across the bid/ask levels, either because of slow action or because a large-volume bid/ask level is taking time to breach. In either case, the proper way to calculate the polarity of volume delta for those updates is to use the last known polarity, which is how I calculate now.
The Order Book
Without access to the order book's levels (the depth of market), we are limited to analyzing transactions that come in the TradingView feed for the chart. That does not mean the volume delta information calculated this way is irrelevant; on the contrary, much of the information calculated here is not available in trading consoles supplied by exchanges/brokers. Yet it's important to realize that without access to the order book, you are forfeiting the valuable information that can be gleaned from it. The order book's levels are always in movement, of course, and some of the information they contain is mere posturing, i.e., attempts to influence the behavior of other players in the market by traders/systems who will often remove their orders when price comes near their order levels. Nonetheless, the order book is an essential tool for serious traders operating at intraday timeframes. It can be used to time entries/exits, to explain the causes of particular price movements, to determine optimal stop levels, to get to know the traders/systems you are betting against (they tend to exhibit behavioral patterns only recognizable through the order book), etc. This tool in no way makes the order book less useful; I encourage all intraday traders to become familiar with it and avoid trading without one.

Market Delta [Makit0]MARKET DELTA INDICATOR v0.5 beta
Market Delta is suitable for daytrading on intraday timeframes, is a volume based indicator which allows to see the UP VOLUME vs the DOWN VOLUME, the DELTA (difference) and the CUMULATIVE DELTA (cumulative sum of difference) between them
This indicator is based on contracts volume (data avaiable), not in ask/bid volume (data not avaiable)
The up/down volume is calculated at each candle as follows:
- calculate the ticks of the range, top wick and bottom wick
- calculate the ticks up and ticks down to get the total ticks of the candle
- calculate the volume per tick as total volume divided by total ticks
- calculate the up and down volume as volume per tick multiplied by up ticks and down ticks
The delta is calculated as volume up minus volume down
The cumulative delta is a cumulative sum of delta and is resetted to 0 twice a day at the globex open and at the us cash open
By default the indicator plots the 'CANDLE MODE' which is useful for charting the cumulative volume to find out support and resistance zones where the volume is rejected or pass thru, as the volume moves so does the price, price always follows the volume, price goes away from where volume dries and price auctions comfortable where is plenty of volume, in a way PRICE FEEDS ON VOLUME
An indication about the plotting style in the volume, delta and cumulative delta modes: I can't use histogram as intended due a bug at autoresizing the scale in the candle mode, so the styles used are areabr and circles.
FEATURES
- Plot volume in one of four modes: Volume Up/Down, Delta, Cumulative Delta, Cumulative Delta as Candles
- Cumulative delta resetted twice a day (globex and cash open)
- Show a base line at 0
SETTINGS
- Mode: select one of the four volume output modes: Volume, Delta, Cumulative Delta and Candles. Candles by default
- Show zero line: show/hide the zero base line. False by default.
HOW TO SETTING UP THE INDICATOR:
BE AWARE, by default the indicator settings are configured for using the Cumulative Delta Candle Mode
- Candles Mode Settings: configured by default, mode candles and zero line off
- Volume, Delta, Cumulative Delta Mode Settings: select the mode you want and switch on/off the zero line
GOOD LUCK AND HAPPY TRADING

Get_rich_aggressively_v5# 🚀 GET RICH AGGRESSIVELY v5 - TIER SYSTEM
### Precision Futures Scalping | NQ • ES • YM • GC • BTC
### *Leave Every Trade With Money*
---
## 📋 QUICK CHEATSHEET
```
┌─────────────────────────────────────────────────────────────────────────────┐
│ GRA v5 SIGNAL REQUIREMENTS │
├─────────────────────────────────────────────────────────────────────────────┤
│ ✓ TIER MET Points ≥ 10 (B), ≥ 50 (A), ≥ 100 (S) │
│ ✓ VOLUME ≥ 1.3x average │
│ ✓ DELTA ≥ 55% dominance (buyers OR sellers) │
│ ✓ DIRECTION Candle color = Delta direction │
│ ✓ SESSION In London (3-5AM) or NY (9:30-11:30AM) if filter ON │
├─────────────────────────────────────────────────────────────────────────────┤
│ TIER ACTIONS │
├─────────────────────────────────────────────────────────────────────────────┤
│ 🥇 S-TIER (100+ pts) │ HOLD LONGER │ Big institutional move │
│ 🥈 A-TIER (50-99 pts) │ HOLD A BIT │ Medium move, trail to BE │
│ 🥉 B-TIER (10-49 pts) │ CLOSE QUICK │ Scalp 5-10 pts, exit fast │
│ ❌ NO TIER (< 10 pts) │ NO TRADE │ Not enough conviction │
├─────────────────────────────────────────────────────────────────────────────┤
│ SESSION PRIORITY │
├─────────────────────────────────────────────────────────────────────────────┤
│ 🔵 LONDON OPEN 03:00-05:00 ET │ IB forms 03:00-04:00 │
│ 🟢 NY OPEN 09:30-11:30 ET │ IB forms 09:30-10:30 │
│ 📊 IB BREAKOUT Close beyond IB + Impulse + 1.3x Vol = HIGH CONVICTION│
├─────────────────────────────────────────────────────────────────────────────┤
│ VOLUME PROFILE ZONES │
├─────────────────────────────────────────────────────────────────────────────┤
│ 🔵 HVN (Blue BG) High volume = Support/Resistance, expect consolidation │
│ 🟡 LVN (Yellow BG) Low volume = Breakout acceleration, fast moves │
│ 🟣 POC Point of Control = Institutional fair value │
│ 🟣 VAH/VAL Value Area edges = S/R zones │
├─────────────────────────────────────────────────────────────────────────────┤
│ MARKET STATE DECODER │
├─────────────────────────────────────────────────────────────────────────────┤
│ TREND UP │ Price > EMA20 + CVD rising │ Trade WITH the trend │
│ TREND DN │ Price < EMA20 + CVD falling │ Trade WITH the trend │
│ RETRACE │ Price/CVD diverging │ Pullback, prepare for entry │
│ RANGE │ No clear direction │ Reduce size or skip │
├─────────────────────────────────────────────────────────────────────────────┤
│ 💎 HIGH CONVICTION UPGRADE │
├─────────────────────────────────────────────────────────────────────────────┤
│ Purple diamond (◆) appears when: │
│ • Strong delta (≥65%) + Strong volume (≥2x) + Market in imbalance │
│ → Consider upgrading tier (B→A, A→S) for position sizing │
└─────────────────────────────────────────────────────────────────────────────┘
```
---
## 🎯 THE TIER SYSTEM
The tier system classifies candles by **point movement** to determine trade management:
| Tier | Points | Action | Expected R:R |
|:----:|:------:|:------:|:------------:|
| 🥇 **S-TIER** | 100+ | HOLD LONGER | 2:1+ |
| 🥈 **A-TIER** | 50-99 | HOLD A BIT | 1.5:1 |
| 🥉 **B-TIER** | 10-49 | CLOSE QUICK | 1:1 |
| ❌ **NO TIER** | < 10 | NO TRADE | — |
---
## ✅ SIGNAL REQUIREMENTS
**ALL conditions must be TRUE for a signal:**
```
SIGNAL = TIER + VOLUME + DELTA + DIRECTION + SESSION
☐ Points ≥ 10 (minimum B-tier)
☐ Volume ≥ 1.3x average
☐ Delta dominance ≥ 55%
☐ Candle direction = Delta direction
☐ In session (if filter ON)
ANY FALSE = NO SIGNAL = NO TRADE
```
---
## 📊 VOLUME DOMINANCE ANALYSIS
This is the **core edge** of GRA v5. We use intrabar analysis to determine who is in control:
```
VOLUME ANALYSIS BREAKDOWN
Total Volume = Buy Volume + Sell Volume
Buy Volume: Who pushed price UP within the bar
Sell Volume: Who pushed price DOWN within the bar
Delta = Buy Volume - Sell Volume
Buy Dominance = Buy Volume / Total Volume
Sell Dominance = Sell Volume / Total Volume
≥ 55% = ONE SIDE IN CONTROL
≥ 65% = STRONG DOMINANCE (high conviction)
```
**Direction Confirmation Matrix:**
| Candle | Delta | Signal |
|:-------|:------|:-------|
| 🟢 Bullish | 55%+ Buyers | ✅ LONG |
| 🟢 Bullish | 55%+ Sellers | ❌ Trap |
| 🔴 Bearish | 55%+ Sellers | ✅ SHORT |
| 🔴 Bearish | 55%+ Buyers | ❌ Trap |
---
## 🕐 SESSION CONTEXT
### Initial Balance (IB) Framework
The **first hour** of each session establishes the IB range. Institutions use this for the day's framework.
```
SESSION WINDOWS (Eastern Time):
LONDON:
├── IB Period: 03:00 - 04:00 ← Range established
├── Trade Window: 03:00 - 05:00 ← Best signals
└── Extension Targets: 1.5x, 2.0x
NY:
├── IB Period: 09:30 - 10:30 ← Range established
├── Trade Window: 09:30 - 11:30 ← Best signals
└── Extension Targets: 1.5x, 2.0x
```
### IB Breakout Signals
```
L▲ / L▼ = London IB Breakout (Blue)
N▲ / N▼ = NY IB Breakout (Orange)
Confirmation Required:
☐ Close beyond IB level (not just wick)
☐ Impulse candle (body > 60% of range)
☐ Volume > 1.3x average
```
**IB Statistics:**
- 97% of days break either IB high or low
- 1.5x extension = first profit target
- 2.0x extension = full range target
- ~66% of London sessions sweep Asian high/low first
---
## 📈 VIRTUAL VOLUME PROFILE ZONES
GRA v5 calculates volume profile zones **without drawing the profile**, giving you the key levels:
### Zone Types
| Zone | Background | Meaning | Action |
|:-----|:-----------|:--------|:-------|
| **HVN** | 🔵 Blue | High Volume Node | S/R zone, expect consolidation |
| **LVN** | 🟡 Yellow | Low Volume Node | Breakout zone, fast acceleration |
| **POC** | 🟣 Purple dots | Point of Control | Institutional fair value |
| **VAH/VAL** | 🟣 Purple lines | Value Area edges | S/R boundaries |
### How to Use
```
ENTERING A TRADE:
At HVN:
├── Expect price to consolidate
├── Look for rejection/absorption
└── Better for reversals
At LVN:
├── Expect fast price movement
├── Don't fight the direction
└── Better for breakouts
Near POC:
├── Institutional fair value
├── Strong magnet effect
└── Watch for volume at POC
```
---
## 🔄 MARKET STATE DETECTION
GRA v5 classifies the market into four states using **CVD + Price Action**:
```
CVD Direction
↑ Rising ↓ Falling
┌─────────────┬─────────────┐
Price > EMA20 │ TREND UP │ RETRACE │
│ (Go Long) │ (Pullback) │
├─────────────┼─────────────┤
Price < EMA20 │ RETRACE │ TREND DN │
│ (Pullback) │ (Go Short) │
└─────────────┴─────────────┘
```
| State | Meaning | Action |
|:------|:--------|:-------|
| **TREND UP** | Buyers in control | Trade long, follow signals |
| **TREND DN** | Sellers in control | Trade short, follow signals |
| **RETRACE** | Pullback against trend | Prepare for continuation entry |
| **RANGE** | No clear direction | Reduce size or wait |
---
## 💎 HIGH CONVICTION UPGRADES
When extra conditions align, GRA v5 marks the signal with a **purple diamond**:
```
HIGH CONVICTION = Base Signal + Strong Delta (65%+) + Strong Volume (2x+) + Imbalance State
```
**Action:** Consider upgrading tier for position sizing:
- B-Tier → A-Tier management
- A-Tier → S-Tier management
---
## 📋 TRADING BY TIER
### 🥇 S-TIER (100+ points)
| | |
|:--|:--|
| **Entry** | Candle close |
| **Target** | IB extension / Next S/R |
| **Management** | HOLD LONGER |
**Rules:**
- Watch next candle - continues? HOLD
- Same tier same direction? ADD
- Opposite tier signal? EXIT on close
- Never close early unless reversal signal
### 🥈 A-TIER (50-99 points)
| | |
|:--|:--|
| **Entry** | Candle close |
| **Target** | 1.5x initial risk minimum |
| **Management** | HOLD A BIT |
**Rules:**
- Target 1.5:1 R:R minimum
- Trail to breakeven after 1:1
- If stalls, take profit
- Upgrade to S-tier management if high conviction
### 🥉 B-TIER (10-49 points)
| | |
|:--|:--|
| **Entry** | Candle close |
| **Target** | 5-10 points MAX |
| **Management** | CLOSE QUICK |
**Rules:**
- Exit in 1-3 candles
- DO NOT hold for more
- Any doubt = EXIT
- Quick scalp mentality
---
## ⚙️ SETTINGS BY INSTRUMENT
| Setting | NQ/ES | YM | GC | BTC |
|:--------|:-----:|:--:|:--:|:---:|
| **Timeframe** | 1-5 min | 1-5 min | 5-15 min | 1-15 min |
| **S-Tier** | 100 pts | 100 pts | 15 pts | 500 pts |
| **A-Tier** | 50 pts | 50 pts | 8 pts | 250 pts |
| **B-Tier** | 10 pts | 15 pts | 3 pts | 50 pts |
| **Min Volume** | 1.3x | 1.3x | 1.5x | 1.3x |
| **Delta %** | 55% | 55% | 58% | 55% |
| **Best Time** | 9:30-11:30 ET | 9:30-11:30 ET | 3-5AM & 8:30-10:30 ET | 24/7 |
---
## 📊 TABLE LEGEND
The info panel displays real-time market data:
| Row | Shows | Colors |
|:----|:------|:-------|
| **Pts** | Candle points | Gold/Green/Yellow by tier |
| **Tier** | S/A/B/X | Gold/Green/Yellow/White |
| **Vol** | Volume ratio | Yellow (2x+) / Green (1.3x+) / Red |
| **Delta** | Buy/Sell % | Green (buy) / Red (sell) / White |
| **CVD** | Direction | Green ▲ / Red ▼ |
| **State** | Market state | Green/Red/Orange/Gray |
| **Sess** | Session | Yellow if active |
| **Zone** | VP zone | Blue/Yellow/Purple |
| **Sig** | Signal | Green/Red if active |
---
## 🔔 ALERTS
| Alert | When | Action |
|:------|:-----|:-------|
| **S-TIER LONG/SHORT** | S-tier signal | Hold longer |
| **A-TIER LONG/SHORT** | A-tier signal | Hold a bit |
| **B-TIER LONG/SHORT** | B-tier signal | Close quick |
| **LON IB BREAK UP/DN** | London IB breakout | Major session move |
| **NY IB BREAK UP/DN** | NY IB breakout | Major session move |
| **HIGH CONVICTION** | Upgraded signal | Consider larger size |
| **LONDON/NY OPEN** | Session start | Get ready |
---
## 💰 THE GOLDEN RULE
> ### **LEAVE EVERY TRADE WITH MONEY**
>
> | Situation | Rule |
> |:----------|:-----|
> | B-Tier | Small win > Small loss |
> | A-Tier | Trail to BE, lock profit |
> | S-Tier | Let it run to target |
> | No Signal | NO TRADE |
> | Wrong Side | EXIT immediately |
>
> **Capital preserved = Trade tomorrow**
---
## ⚠️ DISCLAIMER
> Risk management is **YOUR** responsibility.
> Never risk more than 1-2% per trade.
> Paper trade until you understand the signals.
> Past performance ≠ future results.
---
### Get Rich. Stay Rich. Trade Aggressively. 🚀
**Get Rich Aggressively v5**
*Precision Futures Scalping*

Thin Liquidity Zones [PhenLabs]Thin Liquidity Zones with Volume Delta
Our advanced volume analysis tool identifies and visualizes significant liquidity zones using real-time volume delta analysis. This indicator helps traders pinpoint and monitor critical price levels where substantial trading activity occurs, providing precise volume flow measurement through lower timeframe analysis.
The tool works by leveraging the fact that hedge funds, institutions, and other large market participants strategically fill their orders in areas of thin liquidity to minimize slippage and market impact. By detecting these zones, traders gain valuable insights into potential areas of accumulation, distribution, and liquidity traps, allowing for more informed trading decisions.
🔍 Key Features
Real-time volume delta calculation using lower timeframe data
Dynamic zone creation based on volume spikes
Automatic timeframe optimization
Size-filtered zones to avoid noise
Custom delta timeframe scanning
Flexible analysis period selection
📊 Visual Demonstration
💡 How It Works
The indicator continuously scans for high-volume areas where trading activity exceeds the specified threshold (default 6.0x average volume). When detected, it creates zones that display the net volume delta, showing whether buying or selling pressure dominated that price level.
Key zone characteristics:
Size filtering prevents noise from large price swings
Volume delta shows actual buying/selling pressure
Zones automatically expire based on lookback period
Real-time updates as new volume data arrives
⚙️ Settings
Time Settings
Analysis Timeframe: 15M to 1W options
Custom Period: User-defined bar count
Delta Timeframe: Automatic or manual selection
Volume Analysis
Volume Threshold: Minimum spike multiple
Volume MA Length: Averaging period
Maximum Zone Size: Size filter percentage
Display Options
Zone Color: Customizable with transparency
Delta Display: On/Off toggle
Text Position: Left/Center/Right alignment
📌 Tips for Best Results
Adjust volume threshold based on instrument volatility
Monitor zone clusters for potential support/resistance
Consider reducing max zone size in volatile markets
Use in conjunction with price action and other indicators
⚠️ Important Notes
Requires volume data from your data provider
Lower timeframe scanning may impact performance
Maximum 500 zones maintained for optimization
Zone creation is filtered by both volume and size
🔧 Volume Delta Calculation
The indicator uses TradingView’s advanced volume delta calculation, which:
Scans lower timeframe data for precision
Measures actual buying vs selling pressure
Updates in real-time with new data
Provides clear positive/negative flow indication
This tool is ideal for traders focusing on volume analysis and order flow. It helps identify key levels where significant trading activity has occurred and provides insight into the nature of that activity through volume delta analysis.
Note: Performance may vary based on your chart’s timeframe. Adjust settings according to your trading style and the instrument’s characteristics. Past performance is not indicative of future results, DYOR.
