🔥 AVAX – 15m Technical Analysis (Breakout Setup)
(
 AVAXUSDT )
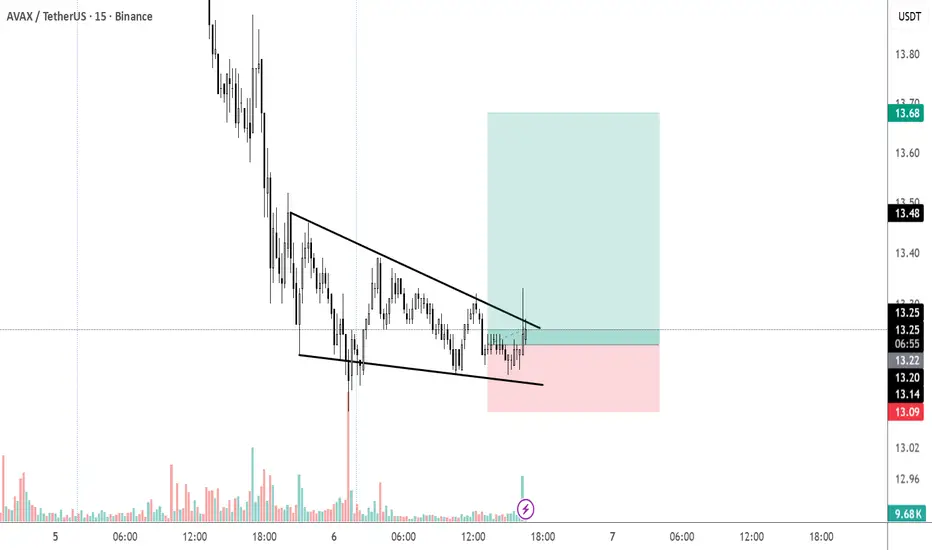
✅ 1) Pattern Analysis – Falling Wedge
A falling wedge usually signals that sellers are weakening, and buyers are absorbing liquidity.
What confirms the breakout?
Price broke above the wedge’s upper trendline.
A large bullish candle with increased volume.
Retest area around 13.20–13.25, which is happening now.
📌 This is a classic bullish breakout behaviour.
✅ 2) Entry Logic
The entry around 13.25 is technically correct because:
It's exactly at the breakout retest zone.
Buying pressure is visible.
Volume supports continuation.
This setup is high probability when supported by volume (which is clearly rising).
✅ 3) Stop Loss (SL)
Your SL below 13.05 – 13.10 is perfect because:
It sits below the wedge structure.
If price returns below this level, the breakout becomes invalid.
This is the correct technical placement.
✅ 4) Take Profit (TP) Projection
Your TP zone around 13.70 – 13.80 is realistic and matches:
Previous major support turned resistance.
Measured move of wedge height placed at breakout.
High-volume node from earlier.
✔ Expected targets:
TP1 → 13.48 (first resistance)
TP2 → 13.68 (upper range)
TP3 → 13.78–13.80 (full wedge target)
✅ 5) Market Behaviour to Expect
After a falling wedge breakout, price typically:
Breaks the trendline ✔
Pulls back slightly to retest the breakout level
Then accelerates upward toward targets
(
✅ 1) Pattern Analysis – Falling Wedge
A falling wedge usually signals that sellers are weakening, and buyers are absorbing liquidity.
What confirms the breakout?
Price broke above the wedge’s upper trendline.
A large bullish candle with increased volume.
Retest area around 13.20–13.25, which is happening now.
📌 This is a classic bullish breakout behaviour.
✅ 2) Entry Logic
The entry around 13.25 is technically correct because:
It's exactly at the breakout retest zone.
Buying pressure is visible.
Volume supports continuation.
This setup is high probability when supported by volume (which is clearly rising).
✅ 3) Stop Loss (SL)
Your SL below 13.05 – 13.10 is perfect because:
It sits below the wedge structure.
If price returns below this level, the breakout becomes invalid.
This is the correct technical placement.
✅ 4) Take Profit (TP) Projection
Your TP zone around 13.70 – 13.80 is realistic and matches:
Previous major support turned resistance.
Measured move of wedge height placed at breakout.
High-volume node from earlier.
✔ Expected targets:
TP1 → 13.48 (first resistance)
TP2 → 13.68 (upper range)
TP3 → 13.78–13.80 (full wedge target)
✅ 5) Market Behaviour to Expect
After a falling wedge breakout, price typically:
Breaks the trendline ✔
Pulls back slightly to retest the breakout level
Then accelerates upward toward targets
Trade aktif
Catatan
TP1 → 13.48 DONE 👌Trading ditutup: target tercapai
ALL TARGETS IS DONEPrice didn't close 1H candle under the sl and go to TP3 👌
Free Telegram Channal: t.me/Mss_Trading
Youtube: youtube.com/@MssTrading
Youtube: youtube.com/@MssTrading
Pernyataan Penyangkalan
Informasi dan publikasi ini tidak dimaksudkan, dan bukan merupakan, saran atau rekomendasi keuangan, investasi, trading, atau jenis lainnya yang diberikan atau didukung oleh TradingView. Baca selengkapnya di Ketentuan Penggunaan.